In This Article

Bitcoin has slipped back below the $84000-$85000 range, which it briefly overcame around the September peak. Demand from ETFs has declined, but each drop is now producing smaller losses, and volatility has returned to summer 2023 levels ahead of the Fed decision on October 28.
Original Glassnode report (in English).
Opening Summary
- Most of the ETF inflows from October 19 have left again, and ETF trading volume has remained low since May.
- Long-term holders own a large amount of coins bought at prices above $85000, and new orders in the Binance order book have dropped to $78000–$79000.
- This year the $84000-$85000 range has reset bitcoin four times, and the price has dropped just below the cost basis of US spot ETFs.
- The US leading economic index has stalled, and the consumer confidence index is near its lowest level since 2009 ahead of the Fed decision.
- Bitcoin’s recovery lasted about three months after the 2023 rally, then slowed, but the number of cohorts creating wallets is growing faster than in the summer of 2023.
- Volatility has returned to its summer 2023 level, and a calmer bitcoin course has been seen in only about 5% of days since 2015.
- Each decline in asset values since August has produced smaller losses, and, excluding internal transfers by one of the cohorts, profit-taking remains minor.
- On the Hyperliquid platform, trading in stocks, indices, and commodities again exceeded the volume of bitcoin perpetual trading.
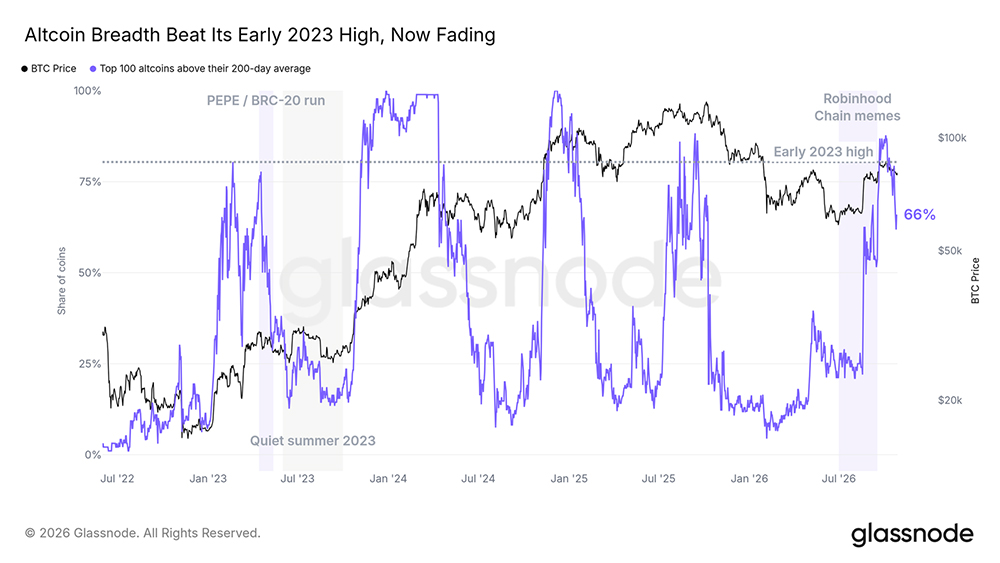
- The share of the top 100 altcoins trading above their 200-day average peaked in early October, surpassing its early-2023 high, and has declined since.
Net ETF Profit
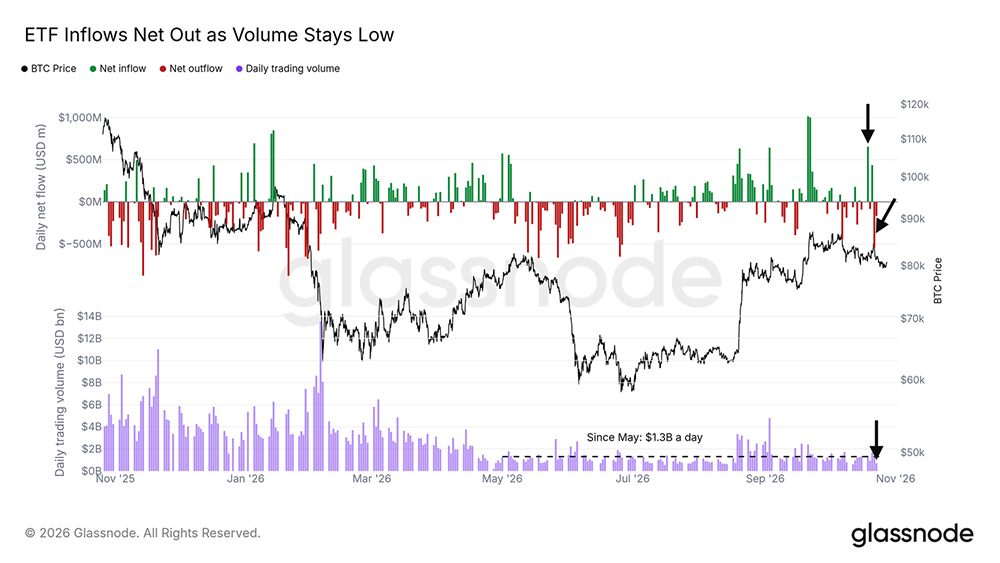
Last week we reported on the $653 million inflow into US spot ETFs on October 19. Most of that money has since been withdrawn again, including $540 million on October 22, and over the past two weeks the funds have attracted only $67 million in net profit.
ETF trading has been sluggish for quite some time. Since early May its volume has been around $1.3 billion per day, well below the figures of previous months. On October 23, volume fell to roughly $700 million, one of the quietest sessions of the year. At the same time, inflows remain at their previous level, suggesting that ETFs are not creating meaningful demand at current prices. The price is also close to the average price paid by ETF holders, as shown below. If inflows resume alongside rising trading volume, that would indicate a recovery in demand.
Holders Build an Inventory
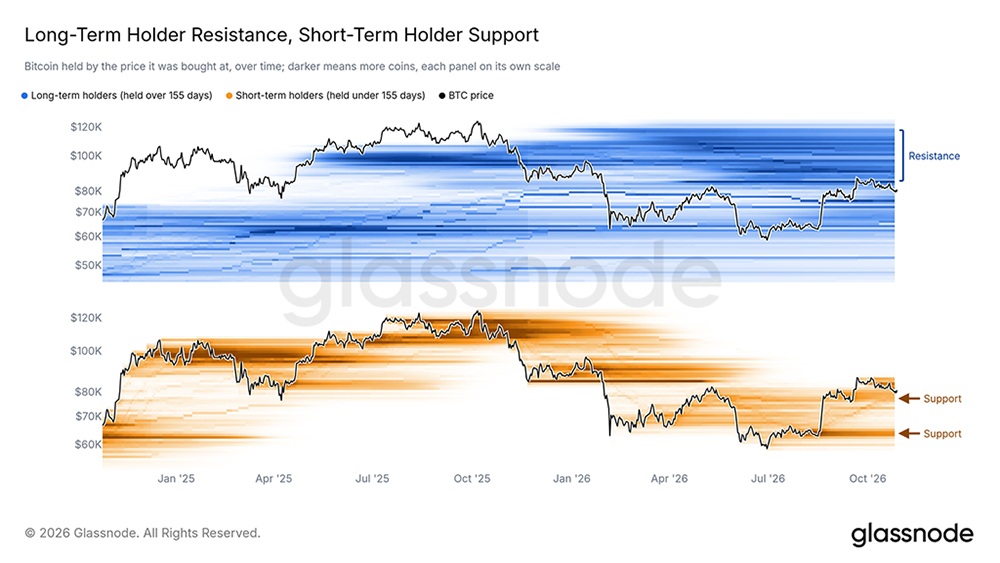
We can see where holders break even in the cost basis distribution, which groups coins by the price at which they last moved. Long-term holders — those who have held coins for more than 155 days — own a large block of roughly 4 million BTC bought at prices from $85000 to $118000, mostly in 2025. More than half of all their coins were bought above today’s price. If the price recovers to around $85000, many of these holders could sell their coins to recoup their money.
On the other hand, most coins currently in the short term were bought below today’s price. The densest cluster sits near $77000, and a second cluster sits near $64000, formed from the 2026 lows. If the price declines, these new buyers are the most likely to defend these levels.
The Next Bid Wall
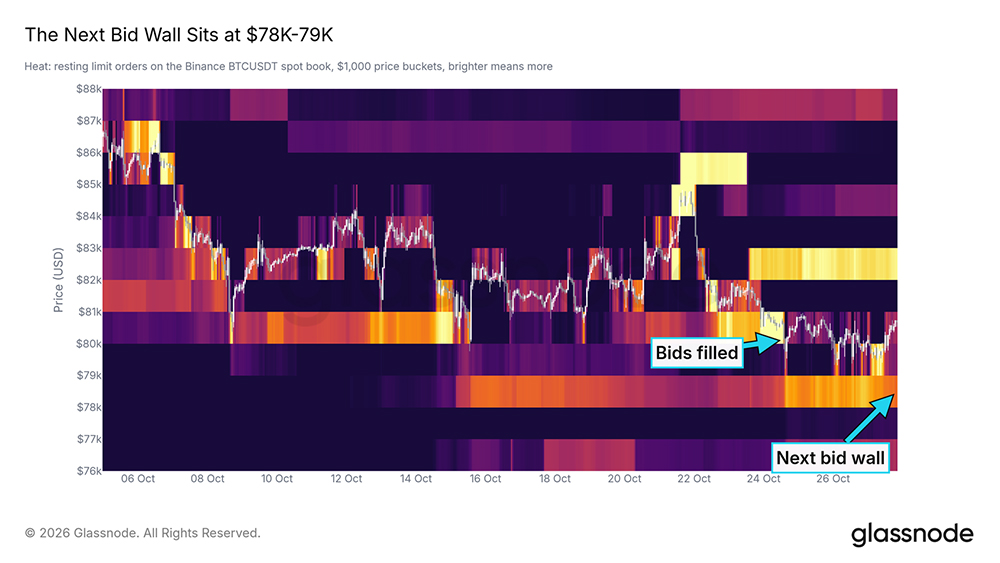
As we noted last week, the bids at $80000 on the Binance spot market were replenished after the October 15 test. The October 24 test knocked them out of play again, and this time they did not return. Only $3.4 million in bids remains at $80000.
Offers have moved down to $78000-$79000, with the order size around $42 million, compared with roughly $24 million in mid-October. This is the largest block of offers near the price, and the first place where we expect buyers to step in if the price declines.
The $84000-$85000 Range
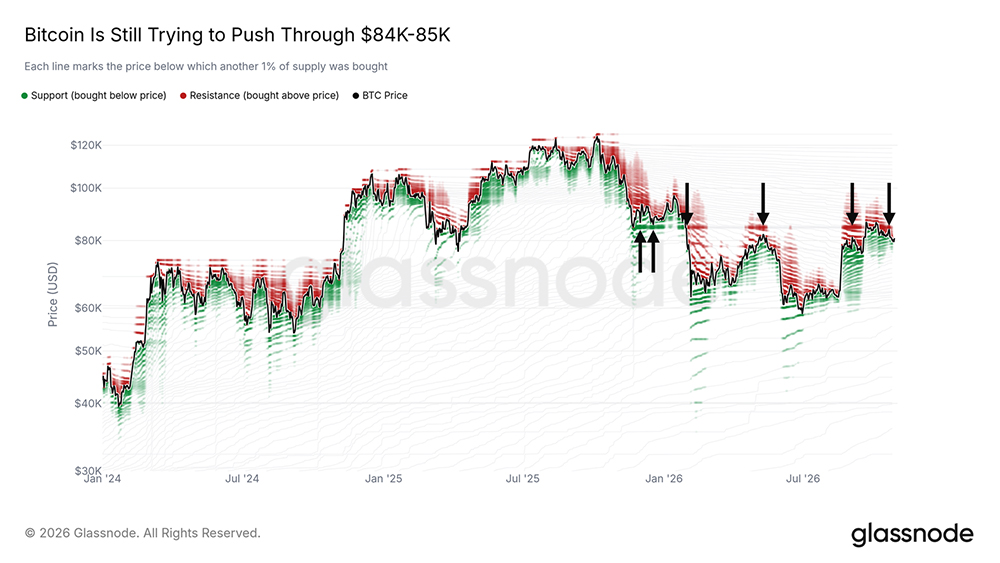
About 4.3% of all bitcoin last moved between $84000 and $85000. Notably, most of that movement occurred in a single day, November 22, 2025, when one large holder transferred coins between their own wallets. Nevertheless, the price has respected this range since then. It served as support in December, when the price bounced off it on December 1 and 18. It was broken on January 31, when an attempt to return to $84000 failed, and bitcoin fell about 20% in the days that followed.
Since then, the resistance band has acted as a restraining factor, blocking price advances at or slightly below it in May, early September, and October 21. Bitcoin did climb above it around the September peak, topping out at $87100 on September 23. But since January it has closed above the band only five days in total, never more than three in a row. A series of daily closes above $85000 would turn the line back into support.
Between Two Cost Bases
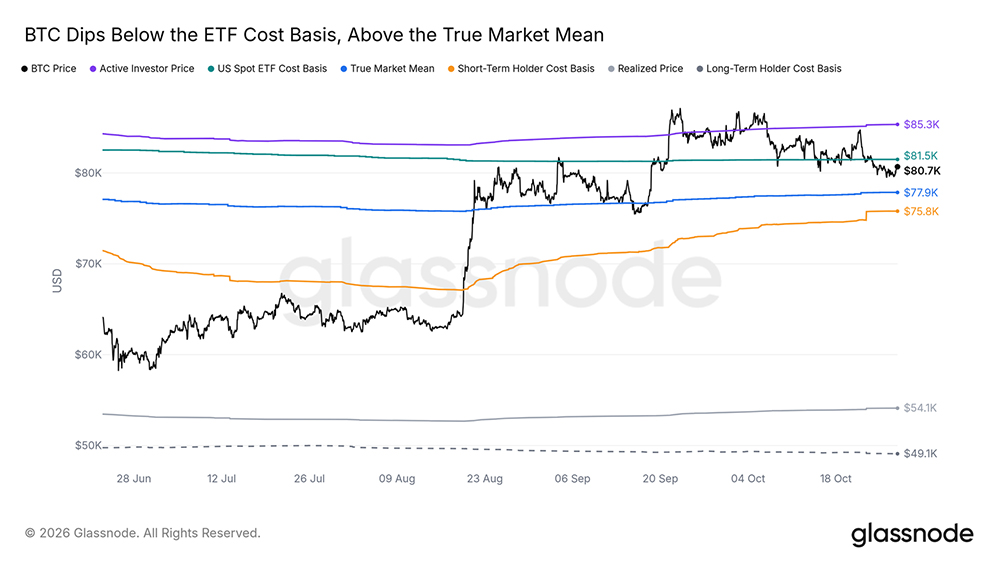
Bitcoin slipped slightly below the average price ETFs paid for their coins in the US spot market — $81500. Below that lies the market average cost basis calculated from active investors — $77900 — and the price stayed above it throughout both October selloffs. The average price paid by new buyers is $75800. A daily close above $81500 would return the average profit level to ETF holders.
Growth Stalls Ahead of the Fed
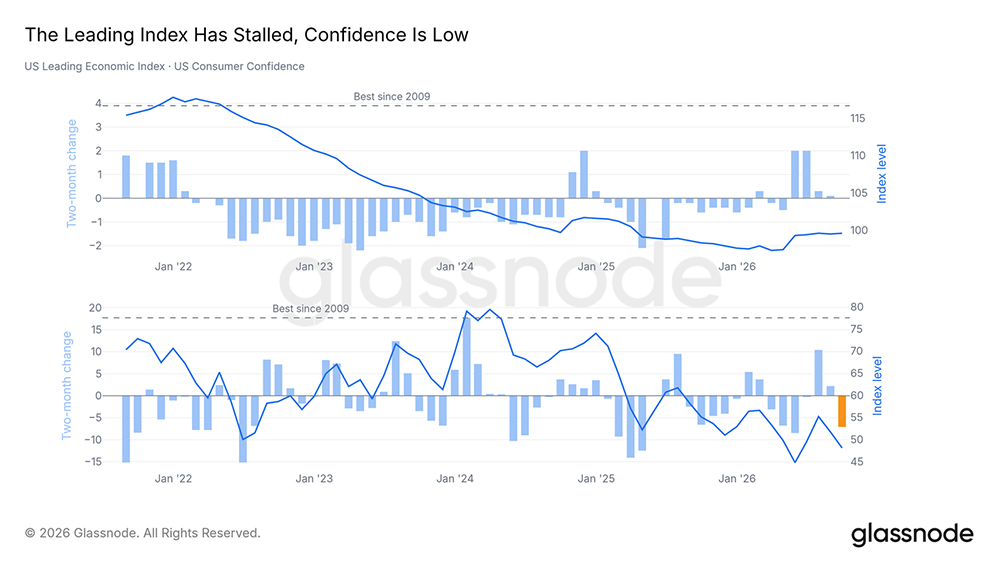
The US leading economic index, a composite of forward-looking indicators, has stopped improving. Its September reading matched July’s, after rising in early summer. The US consumer confidence index fell 7.1 points over the same two months, to 48.1, near its lowest level since 2009.
This is the backdrop against which the Fed decision of October 28 was made. On September 16 the Fed raised rates by a quarter of a percentage point — the first hike since 2023. If it raises rates again, it will further tighten conditions for risk assets, including bitcoin, precisely when growth is slowing and confidence is weakening. The analogous situation in 2023 also occurred amid Fed rate hikes, with the Fed last raising rates in that cycle in July 2023.
The 2023 Lag
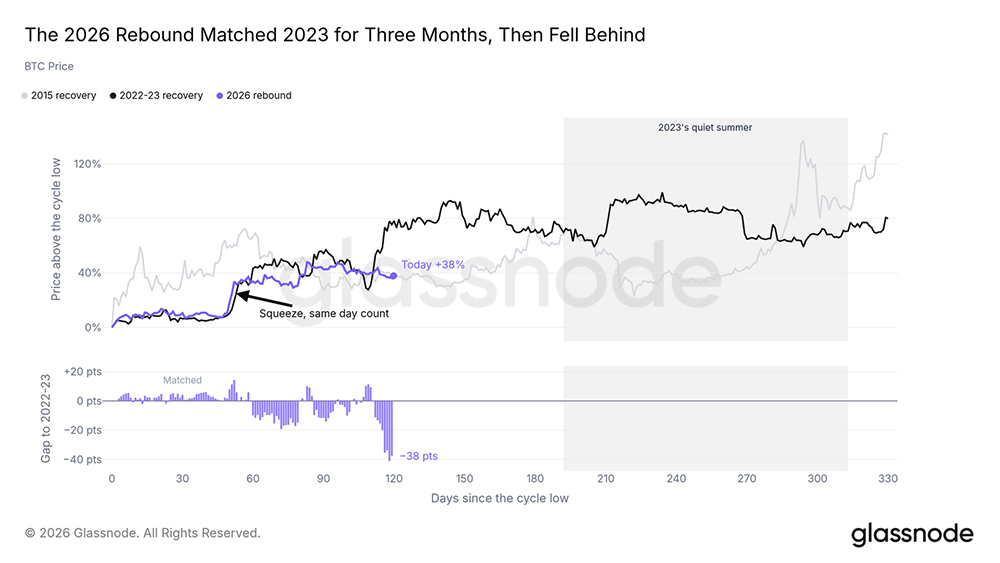
Counting from each cycle’s low, bitcoin’s 2026 bounce followed the 2022–2023 recovery by about three months. In both cases there was a short squeeze at the same point, around day 50, when traders betting on a decline were forced to buy back assets. Since then, the 2026 bounce has lagged. Bitcoin is now 38% above its June low; at the same stage in 2023, the price was 75% above its low.
Wallet Cohorts Divided
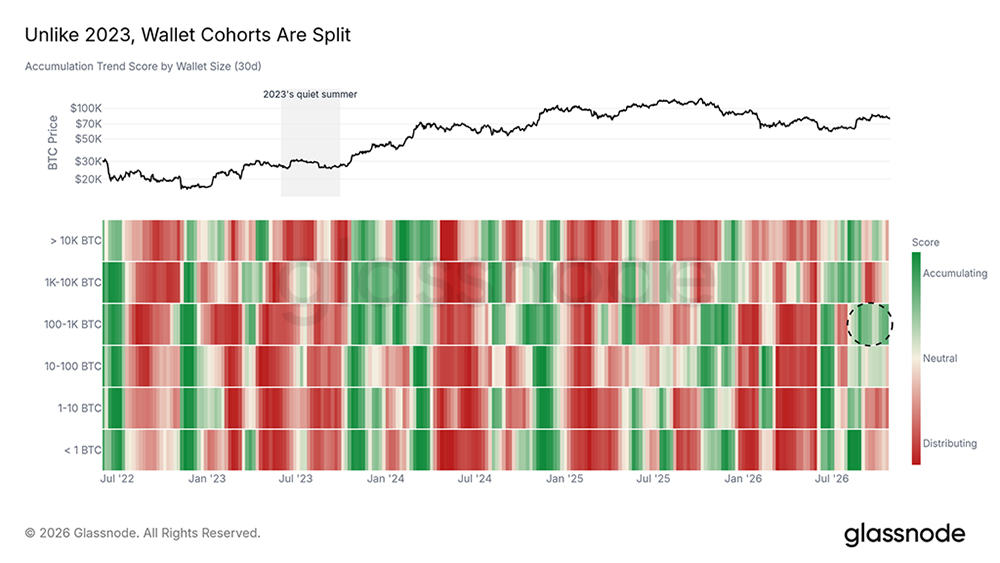
The accumulation trend indicator, which tracks whether wallets of each size are buying or selling, shows that wallets holding 100–1000 BTC have been the most consistent buyers this month. They continue to add to their holdings today. Wallets holding from 10 to 100 BTC and more than 10,000 BTC have also been adding to their holdings for most of the month, but the pace has slowed in recent days. Other cohorts are reducing their holdings.
This is a more favorable picture than in the summer of 2023, when activity was contracting across all cohorts. The growing number of cohorts joining the 100–1000 BTC wallets points to broader demand behind the recovery.
Volatility at 2023 Levels
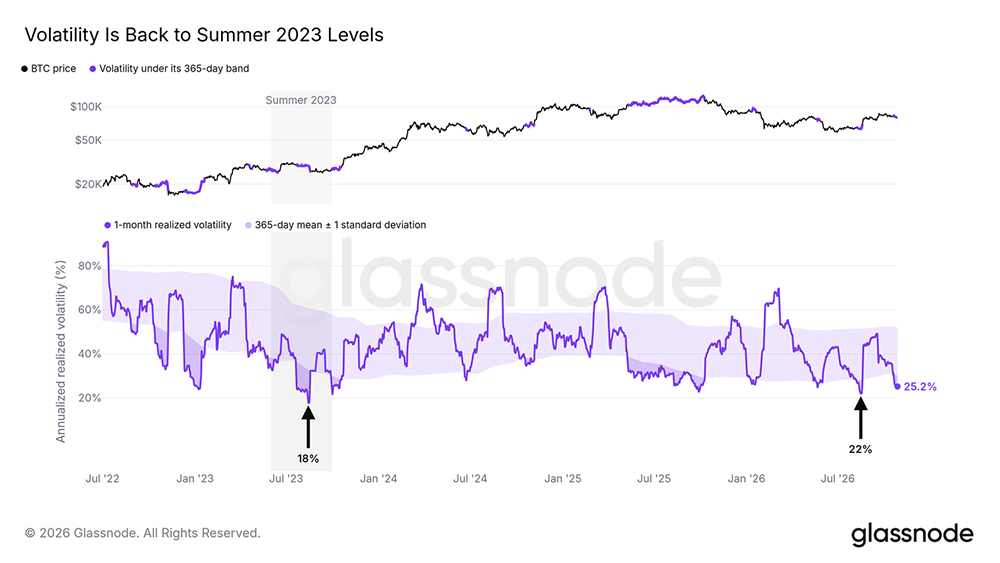
The one-month realized volatility metric (the annualized size of daily price swings over the past month) has fallen to roughly 25%. That is below the usual range of the past year and is back to summer 2023 levels, when the August bottom reached 18%. Since 2015, a calmer bitcoin course has been seen in only about 5% of instances.
The two most recent lows — 18% in August 2023 and 22% in August 2026 — came just days before the sharp selloff in 2023 and the rally in 2026. If volatility stays this low into the Fed decision of October 28, that decision could trigger the next move.
Losses Keep Shrinking
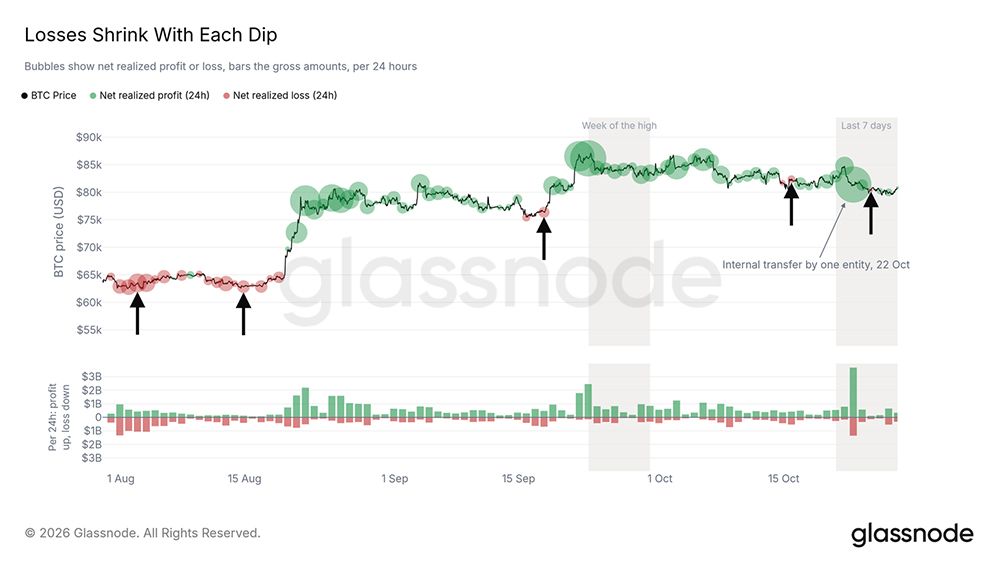
Since August, holders have realized smaller losses with each price drop. At the August low, realized losses exceeded profits by about $630 million in a single day. Around October 24, when prices fell sharply, the largest net loss in a day was about $27 million. This suggests that fewer and fewer holders are willing to sell at a loss when prices drop.
Note that the October 22 spike is the result of coins moving between one entity’s own wallets. By standard measures, this pushed realized profit up to roughly $3.7 billion in a single day and realized loss to about $1.4 billion, even though no sale took place. Our single-entity-adjusted data, which excludes such movements, shows profit-taking of about $260 million per day this week. That is still roughly half of what it was in the week of the September peak. Larger losses on the next decline would signal the return of sellers.
Traders Switch to Stocks
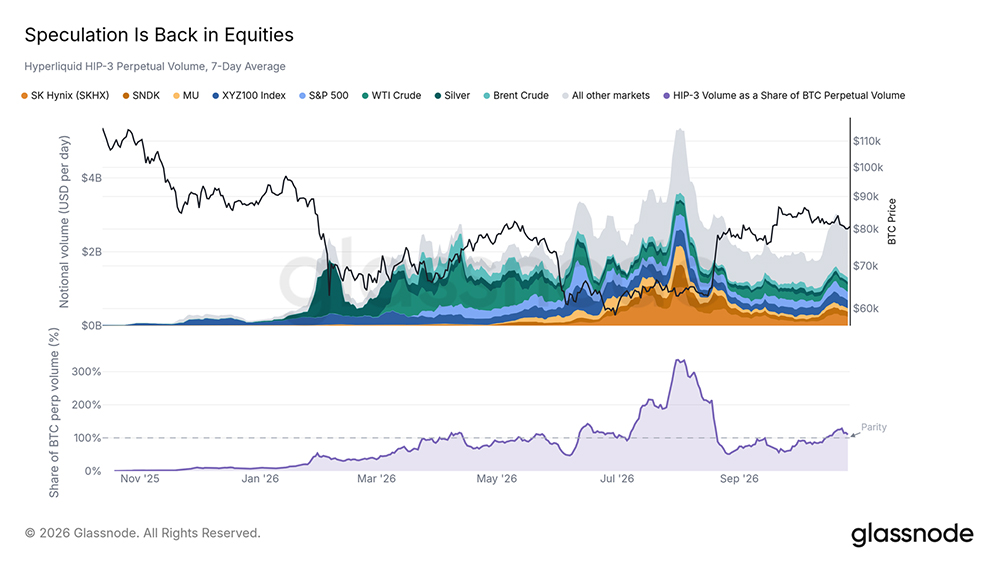
On the Hyperliquid platform, HIP-3 markets let traders take positions on stocks, indices, and commodities via perpetual futures contracts — contracts with no expiration date, similar to those used for crypto. According to Hyperliquid, over the past week trading volume on these markets was around $2.6 billion per day. That is more than the volume of bitcoin perpetual trading on the same venue, which stands at about $2.4 billion.
In early August, HIP-3 volume was more than three times bitcoin volume. By the end of August, after the “squeeze,” it had fallen to about half, and now it has exceeded bitcoin again. The most actively traded individual markets are SK Hynix, the S&P 500, and the technology index, followed by oil. If this volume keeps growing while bitcoin perpetual volume stays unchanged, it will suggest that speculative money still favors stocks.
Altcoin Market Breadth Narrows
Among the top 100 altcoins, the share trading above their 200-day average peaked at 88% on October 4, surpassing its early-2023 high of 80%. Since then it has fallen to 66%, and in the broader top-500 segment to 42%. In 2023 the peak came in February, followed by a bounce during the rise of PEPE and BRC-20 in April, after which came the slump over the quiet summer. This year the peak came roughly a month after the Robinhood Chain meme noted on the chart.
The decline since October points to a narrowing of the altcoin growth zone. If the growth zone keeps narrowing while bitcoin holds in its range, it will point to a weakening risk appetite toward altcoins.
Conclusion
Bitcoin is rangebound and trading calmly. Demand is low, ETF flows are offsetting, and only a few wallet cohorts are adding funds — but selling is also minor, with small losses on each decline. Below are the demand levels at $78000-$79000 and the true market average at $77900; above is the $84000-$85000 range. Last week we said a daily close above $87500, with ETF inflows repeating on rising volume, would show that demand is absorbing the excess supply. A daily close above $85000 would be the first step. A daily close below the true market average would leave the short-term holders’ basis at $75800 as the next level of support. With volatility this low, the next event to watch is the Fed decision of October 28.