What is the OTHERS.D dominance chart?
The OTHERS.D chart shows the percentage share of total cryptocurrency market capitalization held by altcoins outside the top-10. It reflects the condition of the lower-cap altcoin market and is often used to identify market cycles.
OTHERS.D chart
How is the OTHERS.D chart calculated?
Dominance of lower-cap altcoins excluding the top-10 (chart: OTHERS.D) uses two variables and is calculated as follows:
OTHERS.D = OTHERS / MarketCap.Total * 100, where:
- OTHERS is the market capitalization of lower-cap altcoins excluding the top-10.
- MarketCap.Total is the total cryptocurrency market capitalization (calculated using the combined capitalization of the 125 largest cryptocurrencies).
Altcoin dominance excluding the top 10 by year
The OTHERS.D chart dates back to 24 February 2014, when it was launched by TradingView, an analytics platform specializing in cryptocurrency and stock market charts.
| Year | Open | Close | High | Low | Change |
|---|---|---|---|---|---|
| 2025 | 10.54% | n/a | n/a | n/a | n/a |
| 2024 | 13.29% | 10.53% | 13.66% | 10.53% | -20.81% |
| 2023 | 9.99% | 13.30% | 13.74% | 7.80% | +33.20% |
| 2022 | 17.45% | 9.98% | 19.54% | 9.27% | -42.53% |
| 2021 | 6,,47% | 17.37% | 18.26% | 5.63% | +169.49% |
| 2020 | 6.27% | 6.45% | 12.18% | 5.95% | +2.44% |
| 2019 | 6.41% | 6.29% | 8.91% | 4.62% | -1.90% |
| 2018 | 9.15% | 6.41% | 12.33% | 6.04% | -30.01% |
| 2017 | 1.70% | 9.16% | 12.58% | 1.58% | +442.82 |
| 2016 | 0.76% | 1.69% | 5.06% | 0.67% | +120.65% |
| 2015 | 1.61% | 0.77% | 1.99% | 0.62% | -52.67% |
| 2014 | 0.84% | 1.62% | 2.62% | 0.09% |
Frequently Asked Questions (FAQ)
➤ What is lower-cap cryptocurrency dominance?
Lower-cap cryptocurrency dominance, or the OTHERS.D chart, measures the share of total cryptocurrency market capitalization (TOTAL) held by altcoins outside the top-10.
➤ Which cryptocurrencies are excluded from OTHERS.D?
OTHERS.D excludes BTC, ETH and the other top-10 cryptocurrencies by market capitalization.
➤ Why is the OTHERS.D altcoin dominance chart important?
Like other dominance charts, OTHERS is used by market analysts, but focuses on lower-cap cryptocurrencies. A substantial rise usually signals the euphoric phase of the altcoin market known as “altcoin season.”
Market Analysis News
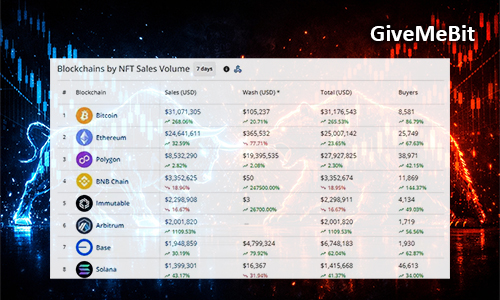
- Sales of NFT rose by 66.58% to $76.56 million

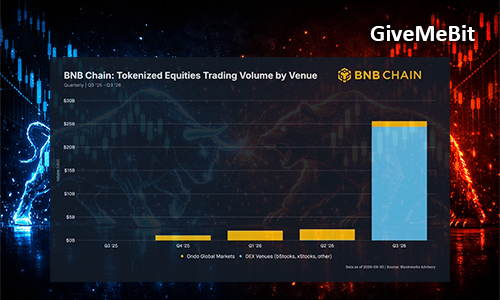
- BNB Chain took 1 place in trading volume of tokenized stocks
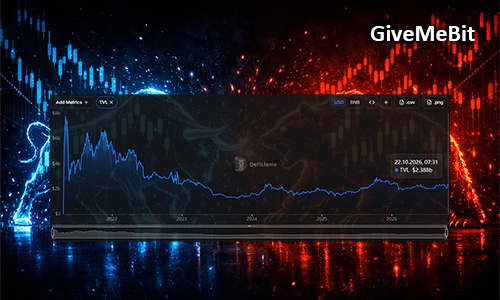
- TVL decentralized exchange PancakeSwap reached nearly $2.4 billion.
- Glassnode Report: Week 42, 2026 — “Swept and Refilled”
- Sales of NFT rose by 24.57% to $47.14 million.
- Stablecoin transfers are 84% cheaper
- Glassnode Report: Week 41, 2026 — “Pinned”