What does the Ethereum dominance chart show?
Ethereum (ETH) dominance shows ETH’s percentage share of the cryptocurrency market. Alongside the Bitcoin dominance chart, financial analysts often use it to identify market cycles and assess Ethereum’s strength relative to other cryptocurrencies over a given period.
Ethereum dominance chart (ETH.D)
The ETH.D chart shows Ethereum’s share of the cryptocurrency market.
How is Ethereum dominance calculated in trading (ETH.D formula)?
The basic Ethereum dominance formula contains only two variables: ETH.D = MarketCap.Total / MarketCap.ETH * 100, where:
- MarketCap.Total is the total capitalization of the cryptocurrency market (calculated using the combined market capitalization of the 125 largest cryptocurrencies).
- MarketCap.ETH is Ethereum’s total market capitalization, equal to the ETH price multiplied by the total number of ETH coins available on the market at a given time.
Ethereum market capitalization chart (MarketCap.ETH)
The MarketCap.ETH chart shows the combined value of all ETH available on the market.
ETH.D history and trends
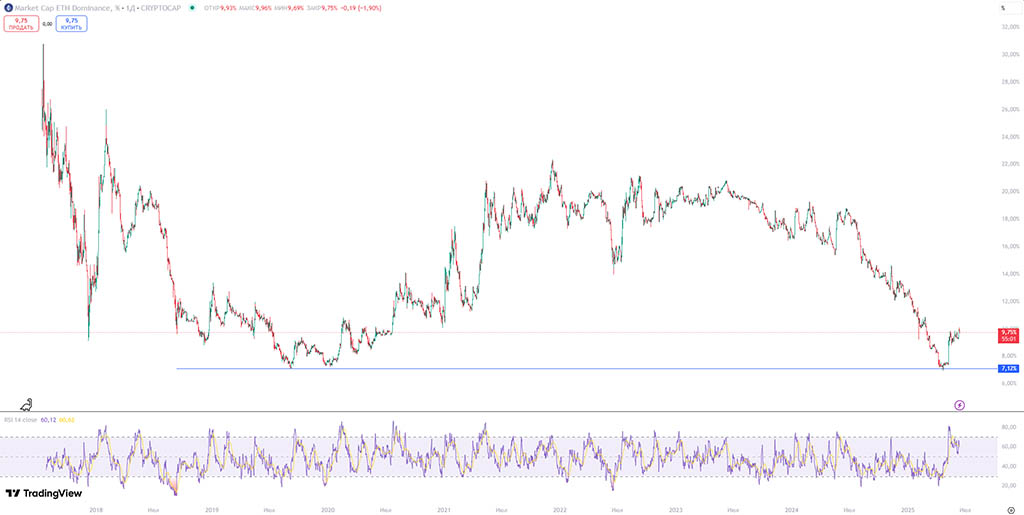
The ETH.D (Market Cap ETH Dominance) chart dates back to 15 July 2017. It was launched by TradingView, a trader analytics platform providing charts for stock, cryptocurrency and other markets.
In the first days after launch, the chart was at its historical peak of 30.78%, then declined steadily to its all-time low of 7.12% on 07 September 2019.
The decline in Ethereum dominance during this period was driven by two external factors:
- The emergence of many alternative coins (altcoins), which began establishing their own share of total cryptocurrency market capitalization.
- Rapid growth in BTC dominance during the bear market of 18-19.
Over the following two years, ETH dominance rose despite short-term corrections and reached a local peak of 22.39% on 08 December 2021. The rise was driven by the broader altcoin bull market during those years.
From then until 22 April 2024, Ethereum dominance returned to a downtrend, largely due to Bitcoin’s continued growth as it absorbed a larger share of cryptocurrency market capitalization.
The 7% area on the Ethereum dominance chart proved to be strong support, and ETH had already rebounded at the time of publication. Will the coming months bring a sharp rise in Ethereum dominance and a broad altcoin season? Time will tell…