In This Article

Bitcoin is stuck below the cost basis set by buyers over the past two years, ETF are selling again, and the September consumer price index came in very hot. At the bottom, the base is holding: the price is above the true market mean and the cost basis of ETF, loss-taking has stopped, and this bear market has never closed below the realized price.
The original Glassnode report (in English).
Introductory Summary
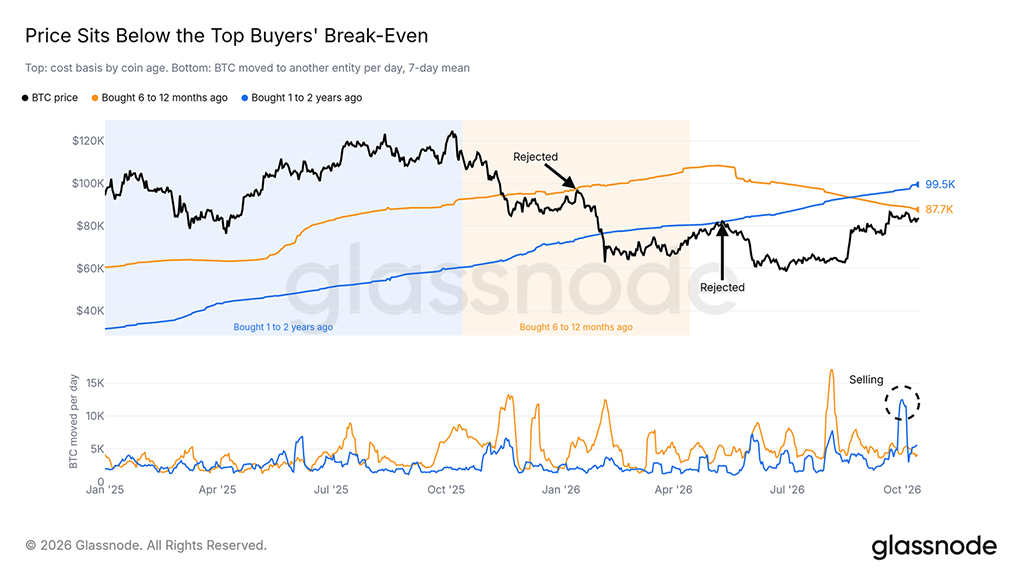
- Buyers of the past two years have set their cost basis above $88000, and this year they have twice pushed the price down.
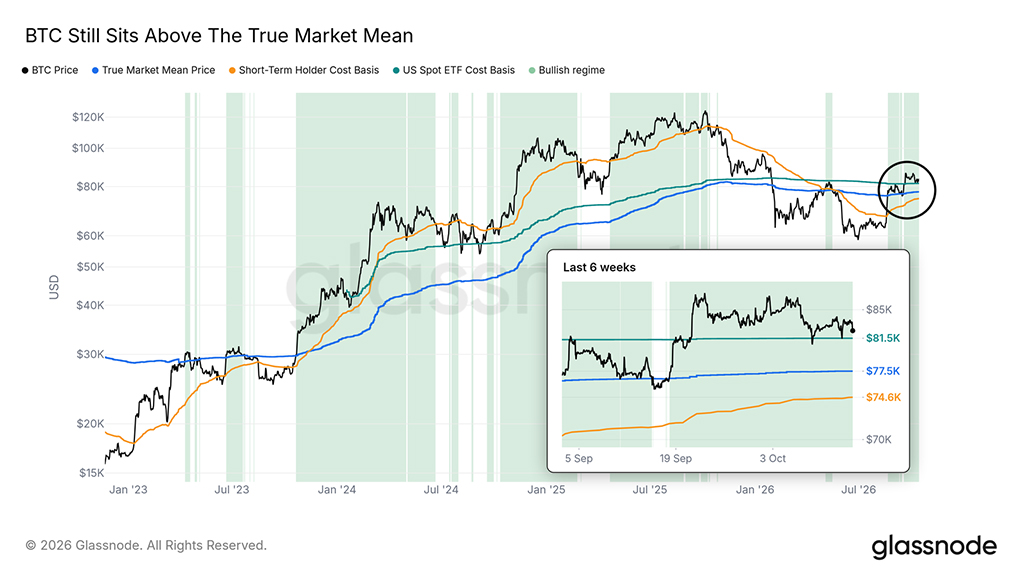
- Bitcoin is holding above the true market mean and has twice bounced off the cost basis of US spot ETF near the $81500 mark.
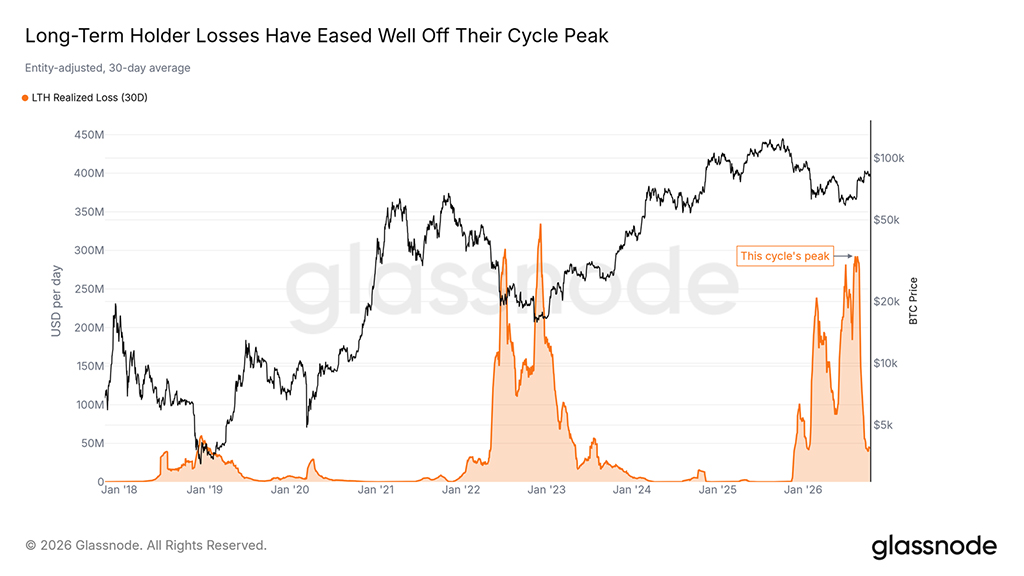
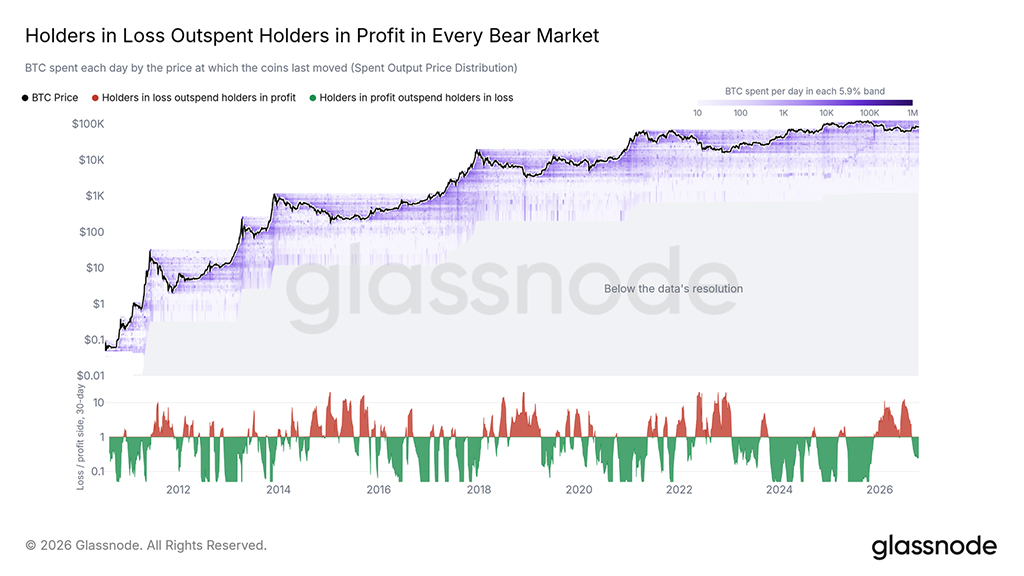
- Long-term investors have largely stopped selling at a loss, and investors taking profit are now spending more than investors at a loss, as was the case during previous periods of economic recovery.
- Demand for ETF in late September did not hold, and the funds have again become net sellers.
- Liquidation clusters of roughly equal size sit on both sides of the price range, and the largest orders in the Binance order book have reached the $80000 mark.
- Unlike the bear markets of 2018 and 2022, this one has never closed below the realized price, and its low has remained well above the cost of acquisition of long-term holders.
- The September consumer price index came in above forecasts, with the interest rate decision due in October and the US midterm elections still ahead.
- Altcoins are frothy depending on the asset, but across the market as a whole the level of froth remains low.
Stuck Below the Sights of the Largest Buyers
Two large groups of holders are trading coins at above-market prices. Coins bought 6-12 months ago, in the late stage of the 2025 rally and the subsequent decline, have a cost basis of around $88000. Coins bought 1-2 year(s) ago are worth even more, around $100000.
Both lines have already turned the price around this year. Bitcoin rose to the cost level of 6-12 months in January, then fell by more than a third. In May it reached the cost level of 1-2 years and fell by roughly a quarter. Holders of bitcoin with a holding period of 1-2 years also stepped up their selling at the start of the October rally.
Until bitcoin breaks through the $88000 mark, every subsequent push upward will run into holders able to sell their assets near the break-even point.
Holding Above Cost
Bitcoin is trading above the true market mean (the average purchase price for active investors), which is close to $78000, and even further above the purchase price of short-term holders. The price has held above both levels since 18 September, and this period on the chart reflects a bullish trend.
A third line now sits closer to the price: the cost basis of US spot ETF, the average price that US spot ETF paid for the coins they hold, is around $81500. Bitcoin dipped below this line on 8 October and again on 13 October, and on both days closed above it. Every daily close since 21 September has remained above this line.
A daily candle close below this level would again put the average ETF holder at a loss and would remove the nearest on-chain support level.
Losses Have Stopped
Long-term holders have largely stopped selling at a loss. Their realized losses peaked on 12 August and have since fallen by roughly 85%. In 2022, the peak of these losses coincided with the period of the cycle low, which was observed just a few weeks later.
With the bulk of the selling complete, coins changing hands are increasingly being sold at a profit.
Profit-Takers Lead Again
The spent coin price distribution sorts each day's spent coins by the price at which they last moved, so it shows where today's supply is coming from. In every bear market since 2011, holders at a loss have spent more coins than holders in profit, and in every bull market the reverse has been true. At the June low, the number of coins spent at a loss was roughly twelve times the number of coins spent at a profit.
In late August the balance shifted. Holders in profit now spend roughly four coins for every coin spent at a loss. Profit-taking can slow the rise, but the same balance held throughout all previous bull markets.
ETF Have Become Sellers Again
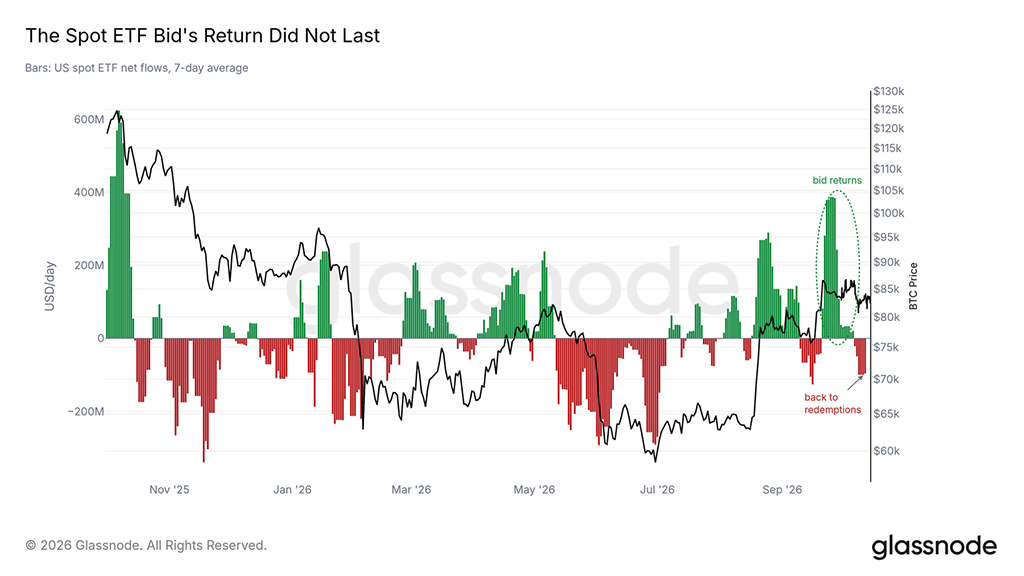
US spot ETF were bought aggressively as bitcoin broke through the $85000 mark in late September. Between 21 September and 6 October, purchases totaled almost $3 billion, the fastest pace since November 2025.
That demand did not last long. Since 7 October, the funds have seen net outflows of about $760 million. With ETF selling their assets and the largest buyers selling them at nearly break-even, there is little new demand behind the price. A return to steady inflows into ETF would be the clearest sign of a recovery in demand.
Levels on Both Sides
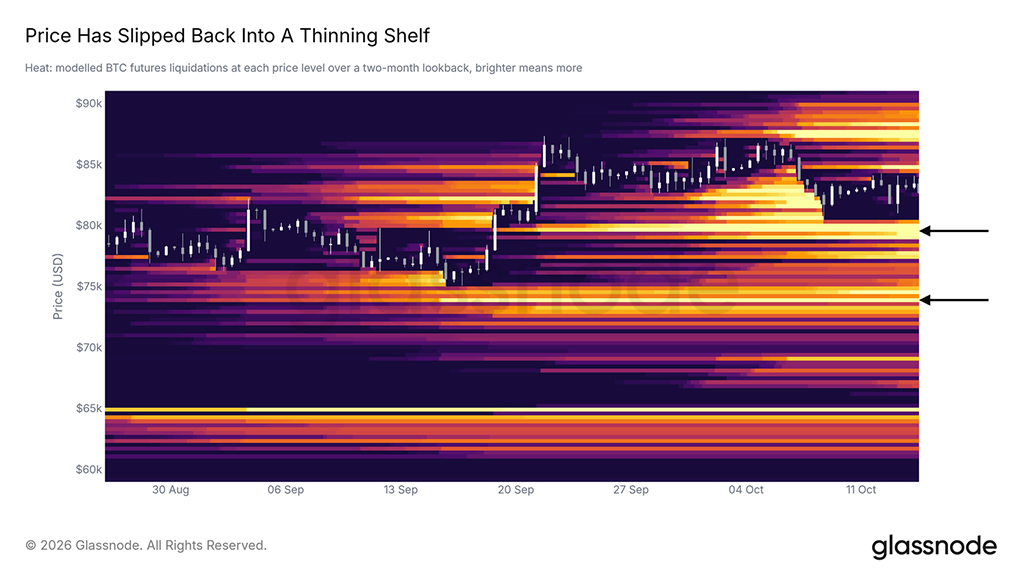
Futures positioning leaves room for moves in either direction. On the two-month liquidation heat map, which models where leveraged positions would be forced to close, the row of levels around the price shrank by more than a fifth over the week. The largest clusters are now further away and roughly equal in size: one just under $80000, the other around $88000.
If the price falls below $80000, forced selling of long positions could deepen the decline. A rise to around $88000, right at the cost basis of 6-12 months, could force short sellers to buy back assets and hold the price at a higher level for some time. Without spot demand, such a squeeze would run into selling from the largest buyers, and holding the price up would be difficult.
Trading Has Begun at Around $80000
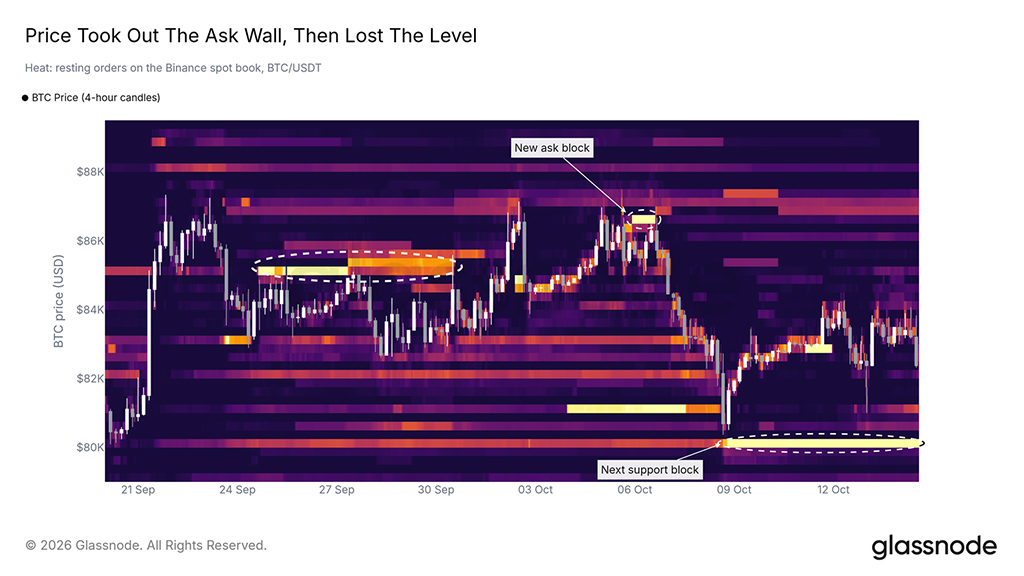
Last week this report pointed to orders at $81000 on the Binance spot market. Bitcoin passed through those levels on 8 October, and the largest order block now sits one level lower, at $80000. It rose sharply in late 8 October and has held at that level since.
This block sits just below the cost basis of the US spot ETF, so the zone between $80000 and $81500 is where the order-book support level and the on-chain support level intersect. A break below this level would bring a liquidation cluster just under $80000, and then the true market mean at around $78000.
A Shallow Bear Market
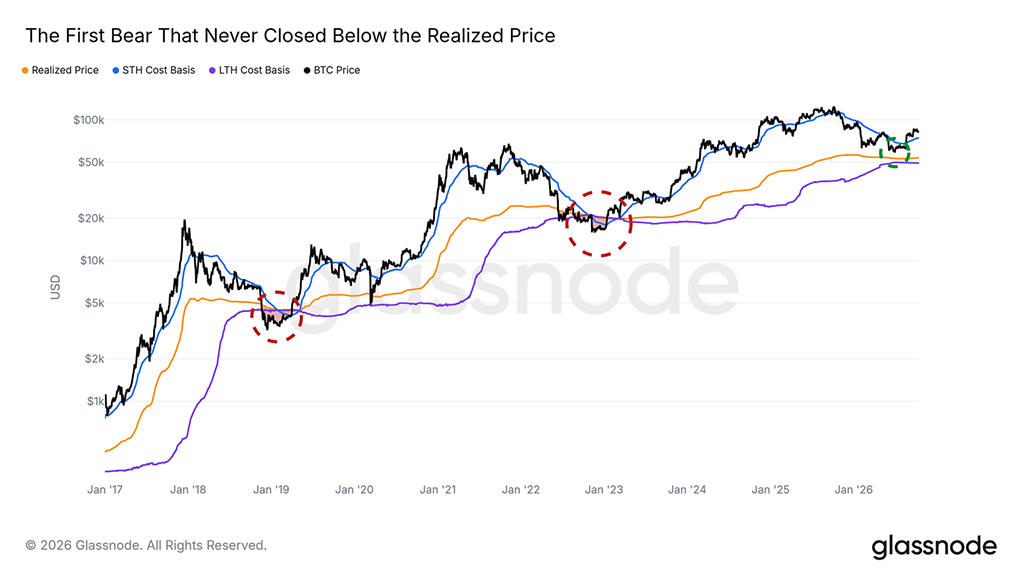
During the downturns of 2018 and 2022, bitcoin spent months below the realized price — the average price paid for every coin in circulation. This decline has never closed below it. Even at the lowest close, on 30 June, bitcoin was about a tenth above the realized price, and higher still — above the long-term holder's cost.
Such a shallow low means the average holder has never fallen below the market level. With the price again above the true market mean and the short-term cost of holding, the cycle looks like the start of a recovery.
Macro Turns Are Getting Harder
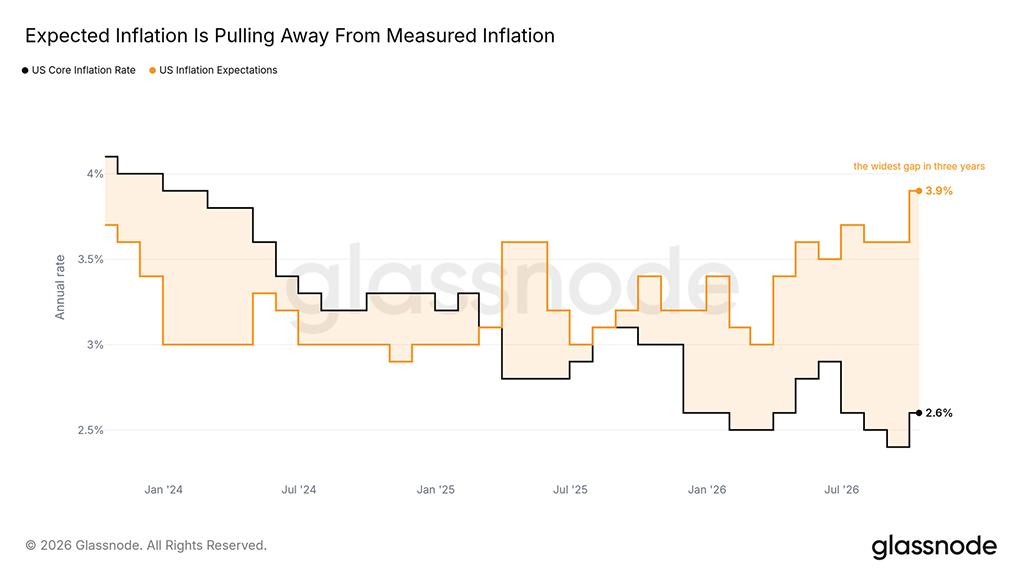
The September consumer price index data published today came in above forecasts: headline inflation was 3.7%, while core inflation (excluding food and energy) was 2.6%. Bitcoin fell within minutes of the release. Household inflation expectations continued to rise, and their gap with core inflation is now the largest in three years.
The Federal Reserve has already raised rates once. On 16 September it raised them by a quarter of a percentage point, the first hike since 2023. Bitcoin took it calmly: over the following three days it barely fell, and a week later it rose by more than a tenth. After today's data, futures traders raised the odds of a second rate hike at the meeting ending 28 October, to be followed by the US midterm elections on 3 November.
Altcoins, Froth, Coin by Coin
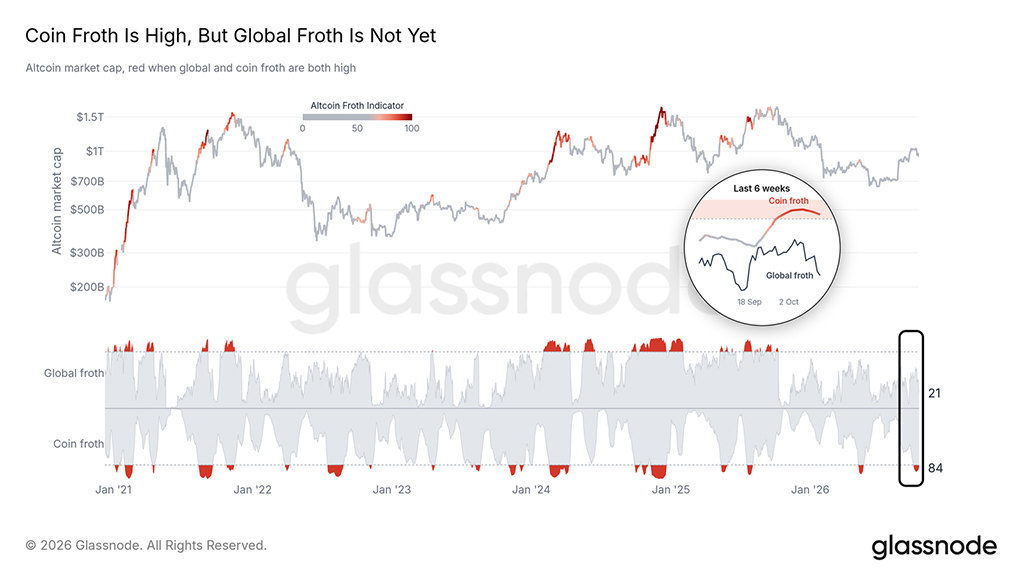
The altcoin "froth" indicator combines two measures, each scored against its own history: altcoin "froth," which tracks how many altcoins carry significant leverage relative to their own past, and "global froth," which applies the same test to the altcoin market as a whole. Altcoin "froth" has been in the top fifth of the list since 28 September. "Global froth" is low and has not entered the top fifth of the list since the crash in October 2025.
Tension within many individual cryptocurrencies, while the market as a whole remains calm, points to pockets of excessive leverage. These pockets will prove the most vulnerable if bitcoin falls to the $80000 level.
Conclusion
Bitcoin is pinned between a solid support level and substantial supply higher up. In the short term, caution is warranted: ETF are selling again, the September consumer price index (CPI) came in hot ahead of the October rate decision and the midterm elections, and buyers of the past two years are waiting near their break-even point above $88000. In the long term, the picture is more favorable: loss-taking has stopped, holders in profit lead in spending, and this bear market has never once closed below the realized price.
A daily candle close above $88000, together with a resumption of inflows into ETF, would signal that demand is absorbing the excess supply. A break of the $80000 level and the cost basis of ETF would put the true market mean at around $78000.
See also: