In This Article

Bitcoin has pulled back roughly 10% from its September high to levels it broke through in August. Short-term holders have shifted from nearly full profit to mostly losses, while spot trading volume remains above its pre-pump level, and the market has weathered the largest hack in the history of cryptocurrency.
The original Glassnode report (in English).
Introductory Summary
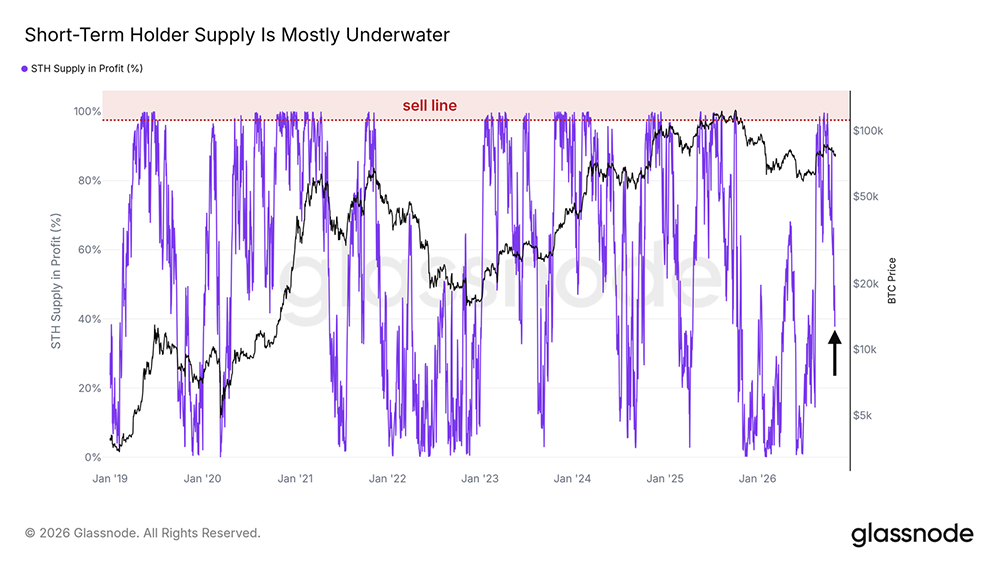
- The share of short-term holders in profit has fallen from nearly 100% in early October to roughly 38%, making the market far less stretched than it was at the September high.
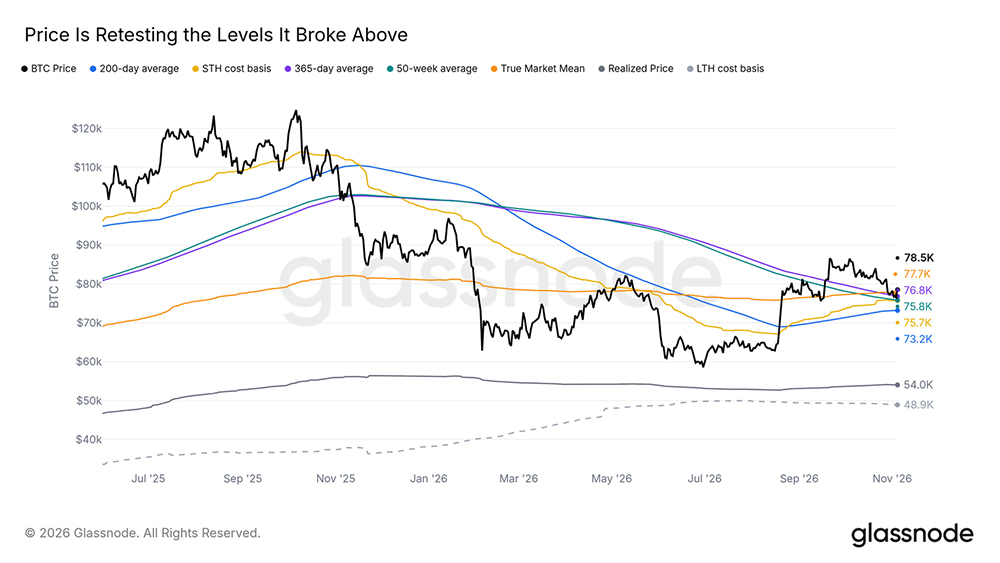
- Bitcoin is retesting levels it broke through in August, with the market’s true mean at $77,700 and the short-term cost basis at $75,700.
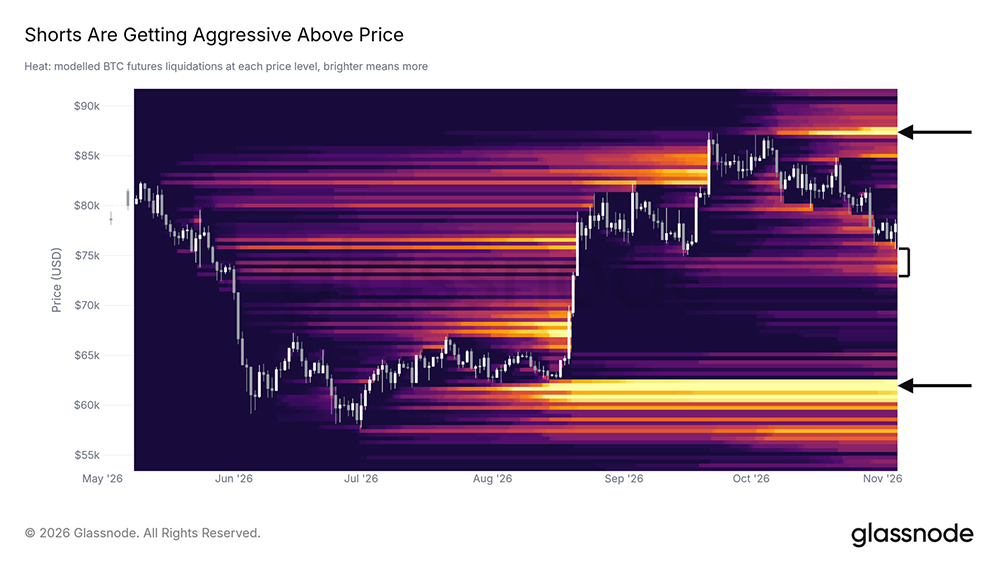
- The correction has allowed most of the long positions accumulated since August to be closed, while shorts have grown above the price, with the largest cluster sitting near $87,000.
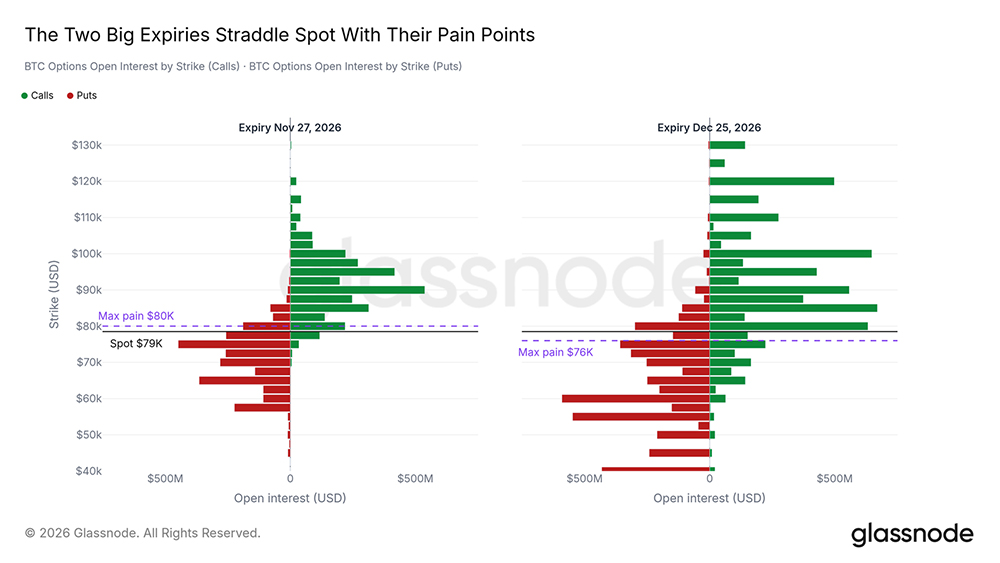
- In the options market, the number of call options exceeds the number of put options, and the largest December call positions are in the range from $80,000 to $120,000.
- Spot trading volume has remained roughly 1.5x the level seen before the hype began; however, over the past two weeks, U.S. spot ETFs have seen a net outflow of nearly $1 billion.
- Over the past two months, bitcoin has held its ground against equities and now wins half of its trading sessions against the S&P 500, something not seen since March 2025.
- The market has weathered the largest hack in cryptocurrency history, which resulted in a decline of roughly 3%.
- The Democrats won both chambers in the midterm elections. After past midterm elections, bitcoin fell again; this time, most of the decline took place before the vote.
- In the altcoin segment, short-term holders are now selling the majority of tokens at a loss, whereas in late September they sold about 80% of them at a profit.
A Healthier Reset
Back in early October, nearly all the coins held by short-term investors who had bought within the last 155 days were in profit. The STH-Supply in Profit metric stood at 97.5% or higher, corresponding to a zone we designate as the sell line, where nearly every recent buyer can take a profit.
After a correction of roughly 10% from the September high, this metric has dropped to about 38%, so most short-term holders now hold their coins at a loss. The market is far less overheated than it was a month ago. If the metric recovers above 50%, it will show that new buyers are once again in profit and regaining confidence.
Retesting the Breakout
Between August and September, bitcoin climbed back above a series of levels it had lost after the 2025 all-time high, including the 200-day moving average, the short-term cost basis (the average price paid by new buyers), and the true market mean (the average cost basis of active investors). Last week, we noted that the price had remained above the true market mean throughout both October periods. On November 3, it closed just below this level, at $77,700, and then dropped to $76,100 overnight before rising back above it.
Retests of breakouts like this are a common occurrence: levels that took months to reclaim are now being tested from above. The short-term holder cost basis at $75,700 and the 50-week moving average sit just below. As long as bitcoin holds above them, the structure formed in August remains intact.
Shorts Pile Up Losses
The liquidation heatmap model shows the prices at which leveraged futures positions would be forced to close. The decline from the September high passed through many of the long-position liquidation levels accumulated since August, which reduces the risk of a forced-selling cascade. Below the price, the range from $73,000 to $76,000 remains, coinciding with the short-term holders’ cost basis and the 200-day moving average, as well as a large block between $60,000 and $63,000 left over from the August breakout.
Over the past week, despite the price falling roughly 3.5%, the liquidation level has risen above the current price. This suggests that traders have been building up short positions during the decline. The largest liquidation cluster sits near $87,000, close to the September high. If the price starts to rise, these short players will have to buy the asset back, which could fuel a move toward this level.
Options Tilted Upward
The two largest upcoming options expiries, November 27 and December 25, have open interest of $5.7 billion and $12.5 billion respectively. The max pain levels, the price at which the largest share of open options expire worthless, are $80,000 and $76,000 respectively, on either side of the spot price, so the options market is not exerting a clear influence in either direction.
Across all expiries, traders hold about $18 billion in call options versus $13 billion in put options. The largest December call positions are at $80,000, $90,000, $100,000, and $120,000, while the largest put positions sit at $60,000 and below, providing protection against a sharp drop. This points to potential upside into year-end. It should be noted that open interest does not show who was buying and who was selling: part of the call open interest is likely being sold by holders to collect the premium, so not every call option is a bet on higher prices.
Trading Volume Persists
Spot and ETF trading volume surged after the August breakout and then declined, but has not returned to its starting level. On a 7-day average, total volume is roughly 1.5 times what it was from mid-July to mid-August, before the jump began, and has remained above that level throughout the correction.
It should be noted that trading volume is still low by the standards of the ETF era. Nevertheless, the fact that the market continues to trade at a higher pace despite a 10% correction suggests that the interest generated by the August move has not faded.
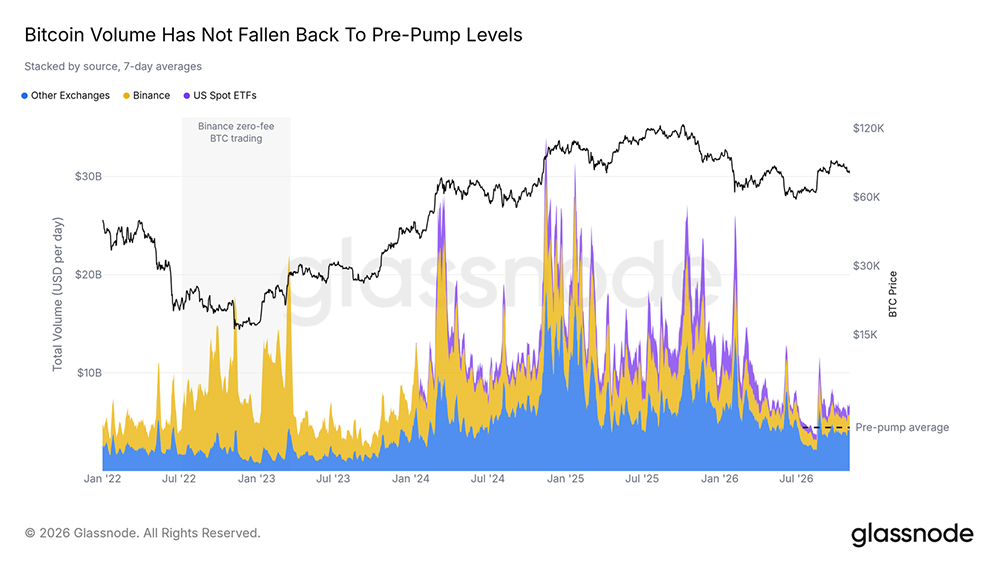
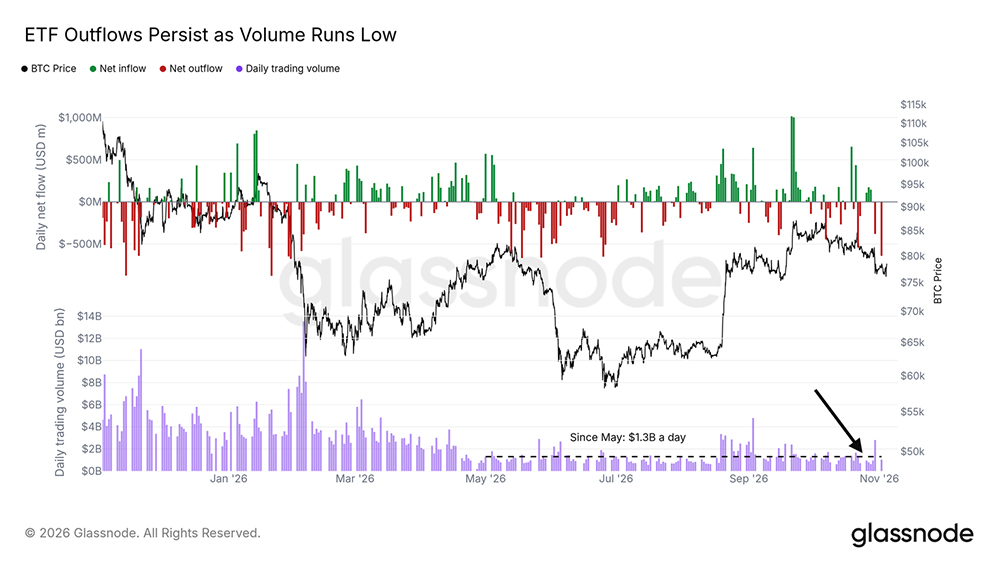
A small portion of this volume comes from U.S. spot ETFs. Over the past two weeks, these funds have seen a net outflow of nearly $1 billion, including $640 million on November 2. Since May, ETF trading volume has averaged about $1.3 billion per day, roughly three times less than in the preceding months.
We interpret this as a market driven by capital already invested in cryptocurrency, moving between assets and venues, with little new money coming in from traditional investors. There are virtually no signs of hype or interest from outside the crypto space. It should be noted that ETF flows tend to follow the price rather than lead it, so their absence is less of a warning about the next move than it might seem.
Is This Holding Up Amid Rising Stocks?
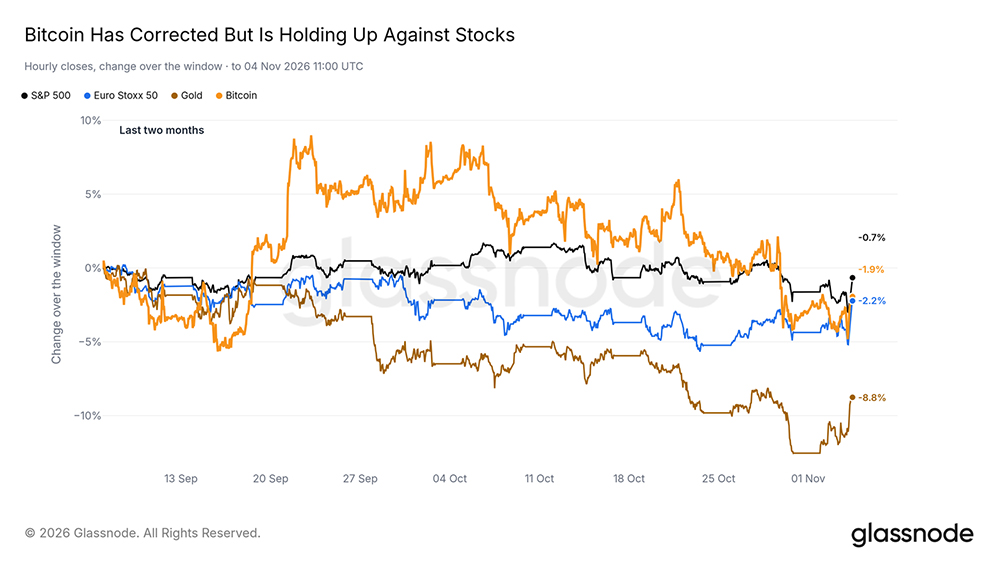
Over the past two months, bitcoin has fallen roughly 2%. This is close to the S&P 500, which declined by less than 1%, slightly ahead of European stock markets, and well ahead of gold, which has lost about 9%. In early October, bitcoin was significantly outperforming equities, but then lost that edge during the correction, though it has corrected while keeping pace with traditional assets.
On Par with the S&P 500
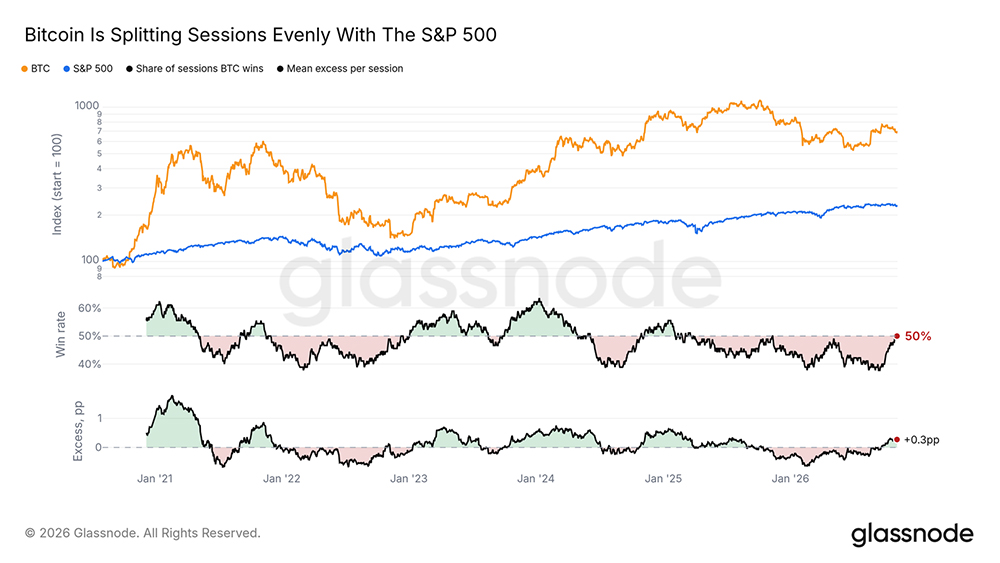
Over the past 90 trading sessions, bitcoin has outperformed the S&P 500 in half of them, and its average per-session gain is now slightly higher. The win rate had not exceeded 50% since March 2025; for most of the past year, bitcoin lost more sessions than it won.
A return to an even split would end a long period of underperformance. If the win rate exceeds 50% and holds there, it will show that bitcoin is regaining ground against equities.
Shrugging Off the Record Hack
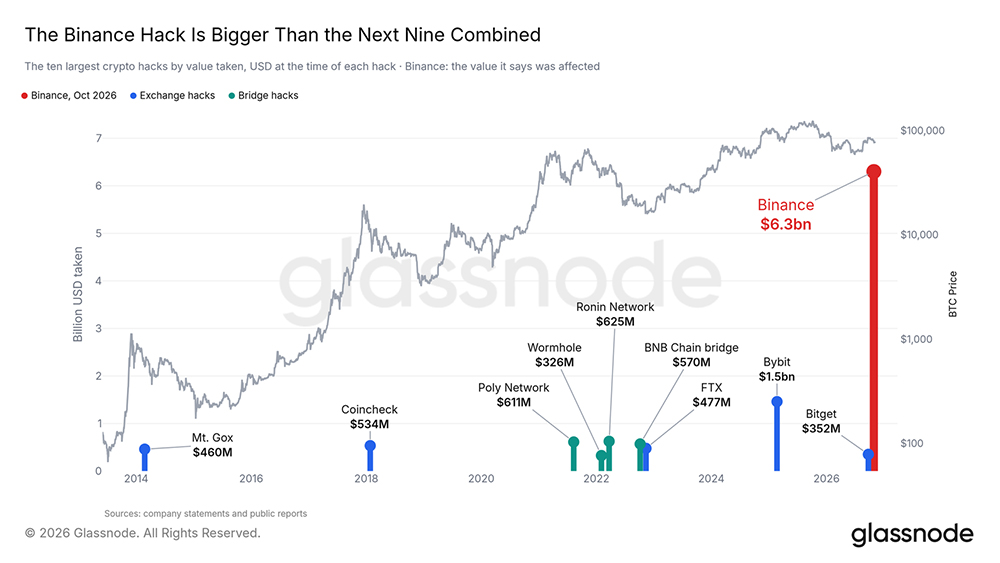
On October 29, Binance reported a hack affecting, by the company’s own estimate, assets worth $6.3 billion. This is the largest hack in cryptocurrency history, exceeding in scale the next nine hacks combined. In the days that followed, bitcoin fell roughly 3% and has now returned to the level where the outflow began.
A muted reaction to such negative news is a sign of strength. It does not change the fact that we see an absence of new demand from outside the crypto market, which is confirmed by the ETF data. If this demand returns, a market that has already absorbed a shock of this magnitude will have room for a rapid rally.
After the Midterm Elections
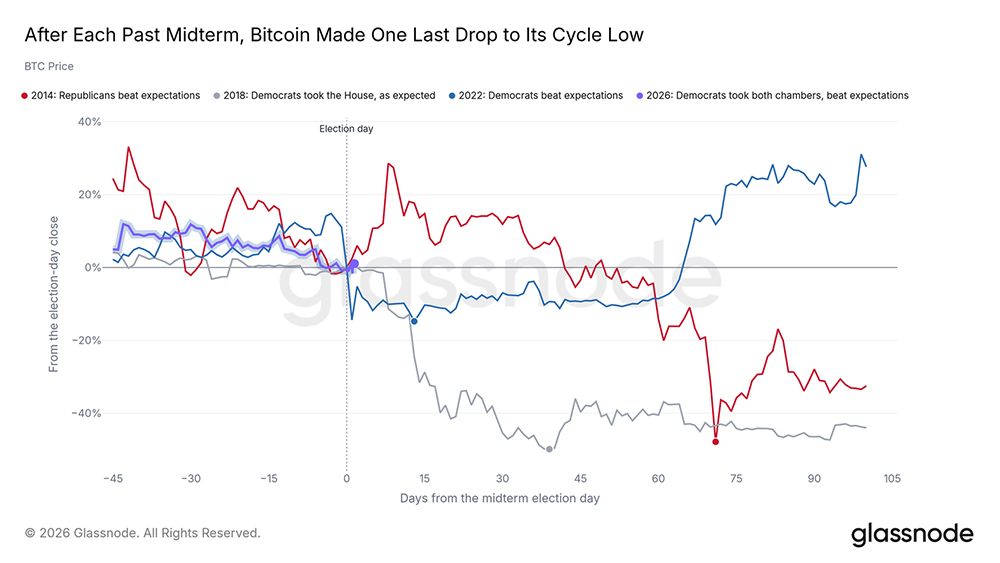
In the U.S. midterm elections on November 3, the Democrats won both the House of Representatives and the Senate, a stronger result than expected. After each of the three previous midterm elections, bitcoin fell once more before reaching its cycle bottom, declining 15–50% over the two to ten weeks up to the vote. This time, most of the decline took place before the vote: bitcoin fell roughly 11% from the September high through election day and has since risen about 1.5%.
In the long run, the industry will have to adapt to a Democrat-controlled Congress. It should be noted, however, that bitcoin is now far more deeply integrated into the traditional financial system than in past cycles, with banks, asset managers, and ETFs investing in it, making the change of power in Washington less dangerous than it would have been a few years ago. Three elections is also a small sample.
Altcoins Work Off the Excess
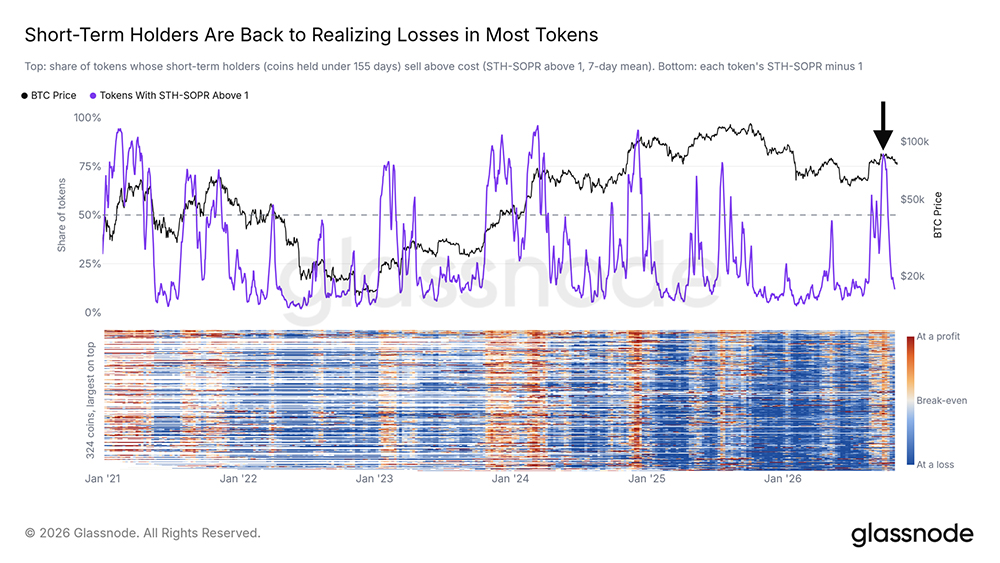
The correction in altcoins has gone deeper. The STH-SOPR metric measures whether short-term holders of tokens are selling at a profit (above 1) or at a loss (below 1). In late September, short-term holders were selling at a profit in about 80% of the more than 300 tokens we track. By the end of October, that share had fallen to roughly 12%, and the typical short-term token holder was selling at a small loss.
Profit-taking after a strong rally has given way to loss realization. If bitcoin holds its retest, the altcoin market, cleared of recent profit-taking, will be a better starting point than September’s overheated market.
Conclusion
Bitcoin has worked off September’s excess: short-term holders have shifted from nearly full profit to mostly losses, altcoin holders are selling at a loss, and the price is retesting its August breakout. Trading volume remains high, and the record hack barely affected the price, but new money from outside cryptocurrency is still absent.
This provides a better balance of risk and potential reward than the September high. Attention should be paid to the range from $73,000 to $76,000, where the short-term cost basis of assets, the 200-day moving average, and a cluster of long liquidations converge. If this level holds, the retest will signify a confident reset within the August uptrend. A sustained break below $73,000 would point to a more extended consolidation.