In This Article

Bitcoin is holding above its key price levels, profit-taking remains minor, but inflows into ETF have declined, trading volume is low, and a wave of sell orders at $85000–$85500 is capping the price.
The original Glassnode report (in English).
Introductory summary
- In late September, US spot ETF attracted about $1 billion on each of two days; since then, inflows have weakened, and the price has remained flat.
- Profit-taking remains weak compared with past highs, although long-term holders stepped up their selling this week.
- Over the last 30 trading sessions, bitcoin has most often outperformed the S&P 500, though this week it fell harder than stocks.
- The price is capped by a multitude of sell orders at $85000–$85500. The true market average at $77200 is the first support level below that figure.
- Total trading volume is near the lower end of its range since the launch of US spot ETF, making the early-stage rally speculative.
- Over the past month, altcoins outperformed bitcoin with virtually no hype or new borrowing opportunities, but this week their growth stalled.
Demand for ETF has declined
Two heavy days, then a decline
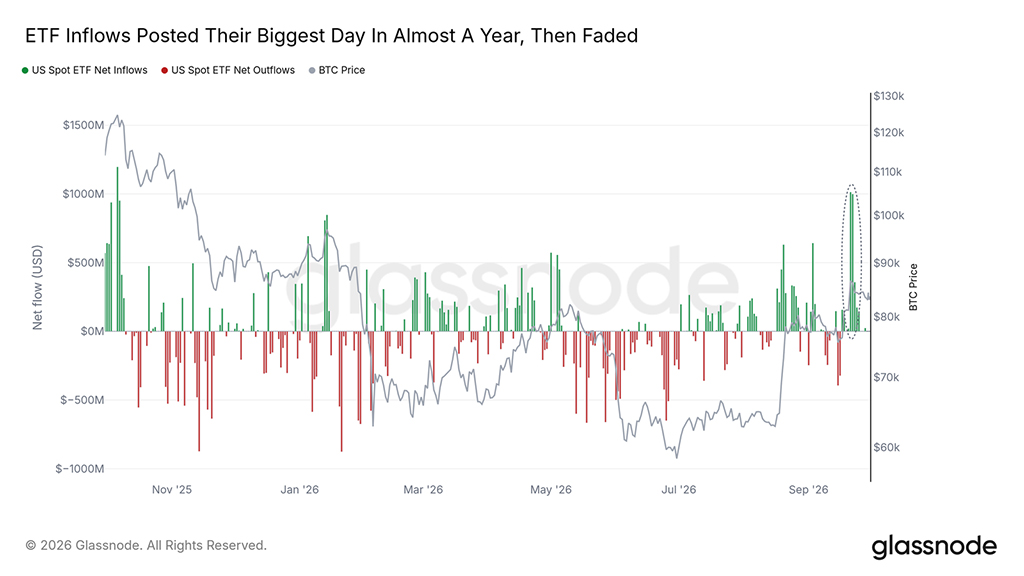
The peak in ETF purchases came on 21 and 22 September, when net inflows into US spot ETF amounted to about $1 billion per day. The first of those days was the largest in nearly a year. Since then, inflows have shrunk every trading day, reaching $24 million on 28 September, the last day for which data is available, while the price has remained flat.
Last week's report noted an increase in ETF purchases. Funds are still buying, but at a much slower pace than during those two days. A return to inflows close to the current level would be the clearest sign of renewed demand for ETF.
Modest selling, new sellers
Well below previous highs
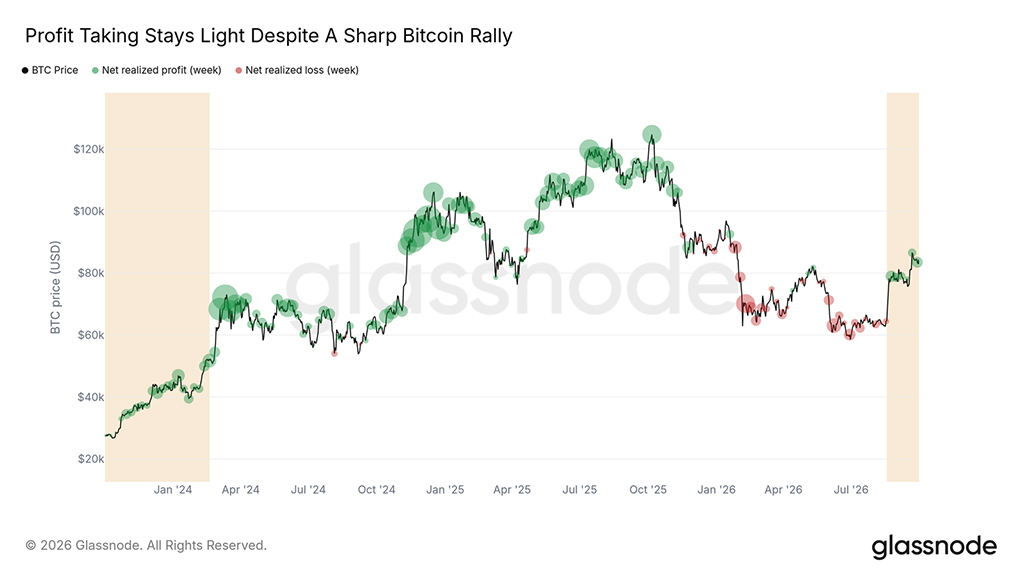
Profit-taking remains minor compared to past cycles. Weekly net realized profit/loss (the net dollar gain recorded as coins change hands) is well below the average weekly figure at the peaks of 2024 and 2025. The pace of this growth (the right band on the chart) is close to the start of the last uptrend in late 2023 (the left band).
However, the composition of sellers has changed. Long-term holders, who have held their coins for more than 155 days, nearly doubled their realized profit in the week before 29 September compared with the breakout week, and their share of total realized profit rose from 34% to 55%. If weekly profit-taking approaches the levels of past highs, it will indicate that holders are selling into strength.
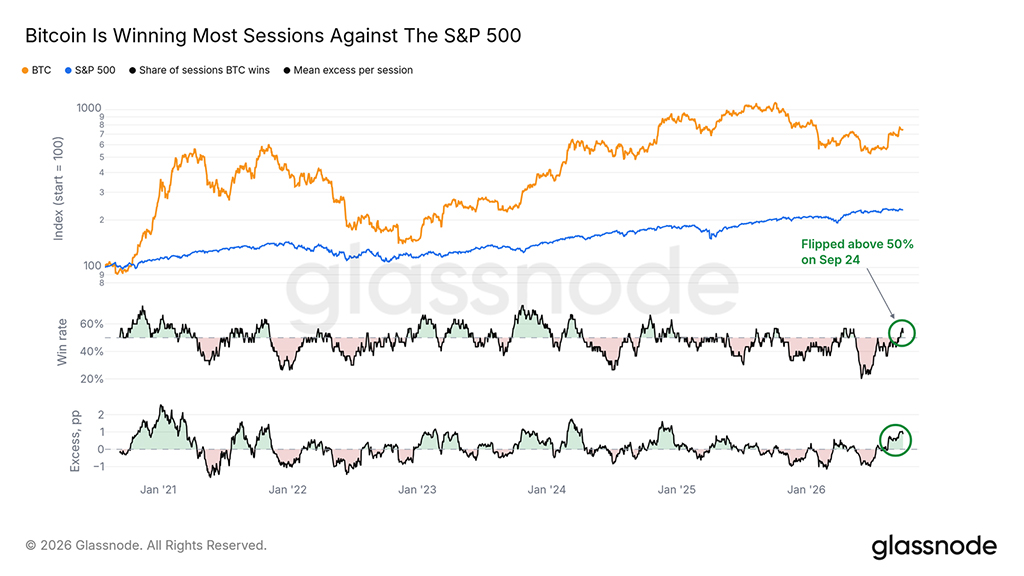
A short-term edge over stocks
More than 30 successful sessions
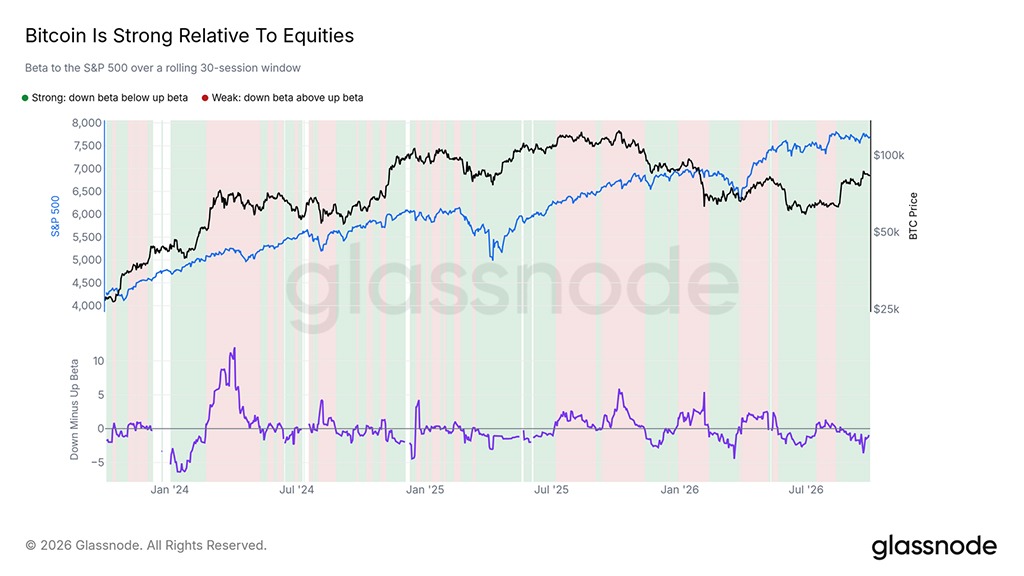
Over the last 30 trading sessions, bitcoin has reacted less to declines in the S&P 500 than to its rises. This pattern is highlighted in green on the chart, and it has persisted since 20 August. This period also includes the August rally.
This week, the edge weakened. From 22 to 29 September, bitcoin fell 2.9% versus 1.2% for the S&P 500, a steeper drop than the index saw on its down days. If the edge over stocks disappears after the August session ends, it will turn red.
How to win more sessions
Bitcoin has also outperformed the S&P 500 in more than half of the last 30 trading sessions. On 24 September, its share exceeded half for the first time since mid-May.
The margin is small, and a few losing sessions could push the price back below the midpoint. If the share remains above the midpoint through October, it will show that this edge is not just a fleeting success.
A wall overhead
The asking amount is $85000
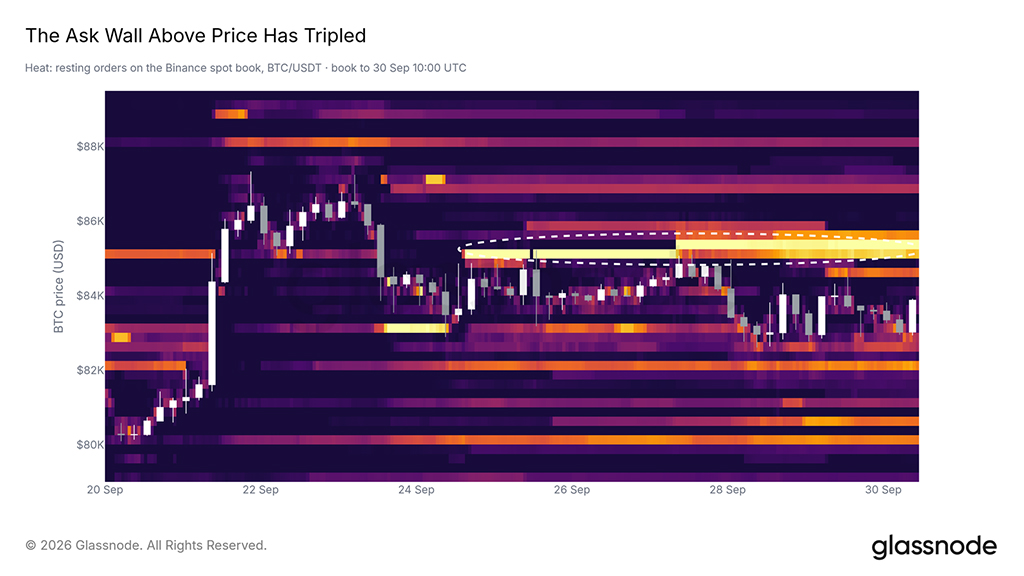
Last week's report named $84000 as the level to hold. Since then, the price has slipped just below that level, and a wall of sell orders on the Binance spot market now caps it from above.
This wall sits between $85000 and $85500. It appeared on 24 September and has tripled in size since. The price has advanced into the lower half of this wall but has been unable to break through it.
As long as these orders remain in place, the resistance level is the most important one. A sustained breakout above $85500 would clear the highest resistance in the market.
Support below
Recent buyers are in profit
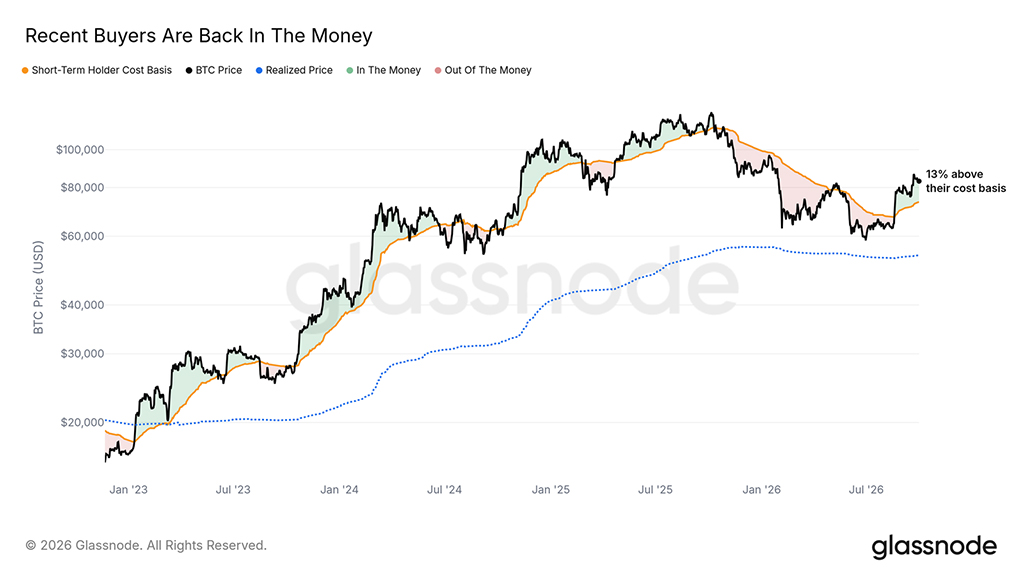
The short-term holder cost basis (the average price paid for coins held for less than 155 days) is $73300. The price is trading roughly 13% above this figure, so recent buyers are in profit.
In the uptrends of 2023 and 2024, the price spent several months above this line, highlighted in green on the chart. A fall below it would again put recent buyers at a loss, as was the case for most of the first half of 2026.
Above the true market average
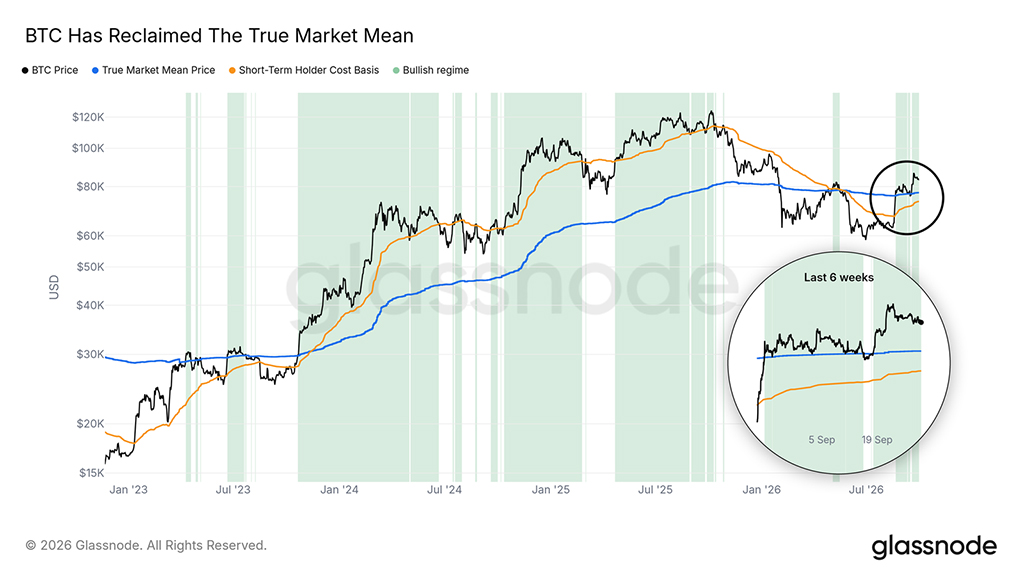
The price is also holding above the true market average, an estimate of the average price paid by active investors, since 18 September. The average stands at $77200, roughly 8% below the current price.
From 2023 through 2025, levels above both the true market average and the Short Term Holder Cost Basis marked the stronger phases of the uptrend, highlighted in green on the chart. The true market average is the first support level to watch: a daily candle close below $77200 would end the current period.
Trading volume lags the price
Trading remains quiet
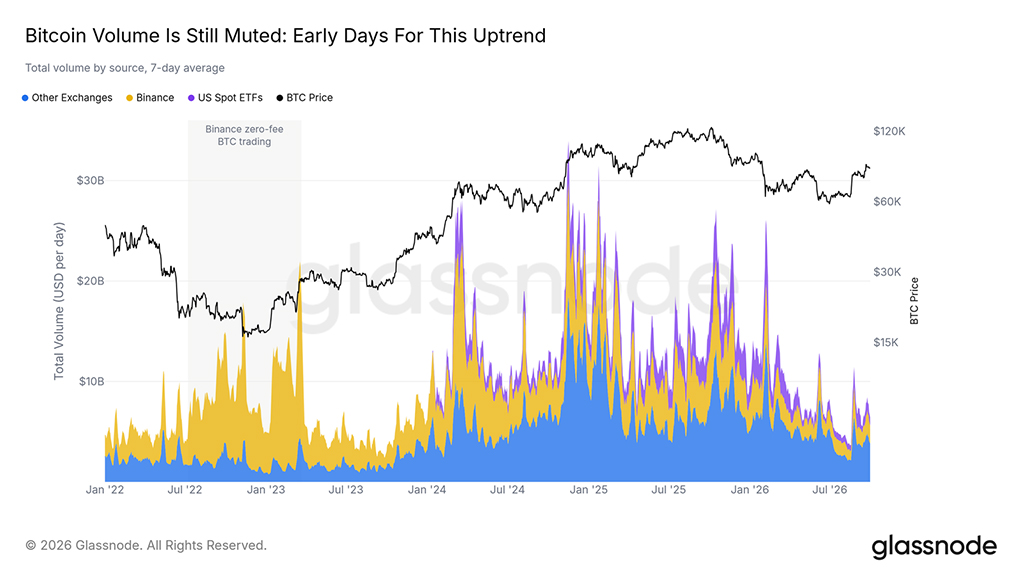
Last week's report noted that spot trading volume had more than doubled from its August low. That rebound began from a very low level. Total trading volume in bitcoin, spot exchanges, and US spot ETF combined averages about $6.4 billion per day and sits near the lower end of its range since the launch of ETF.
With trading volume this low, the rally is still at an early stage and speculative in nature, with broad demand yet to form. Sustained growth in trading volume while the price holds above the true market average would signal that the uptrend is gaining broader support.
Altcoins pause their use of leverage
Few coins are in profit
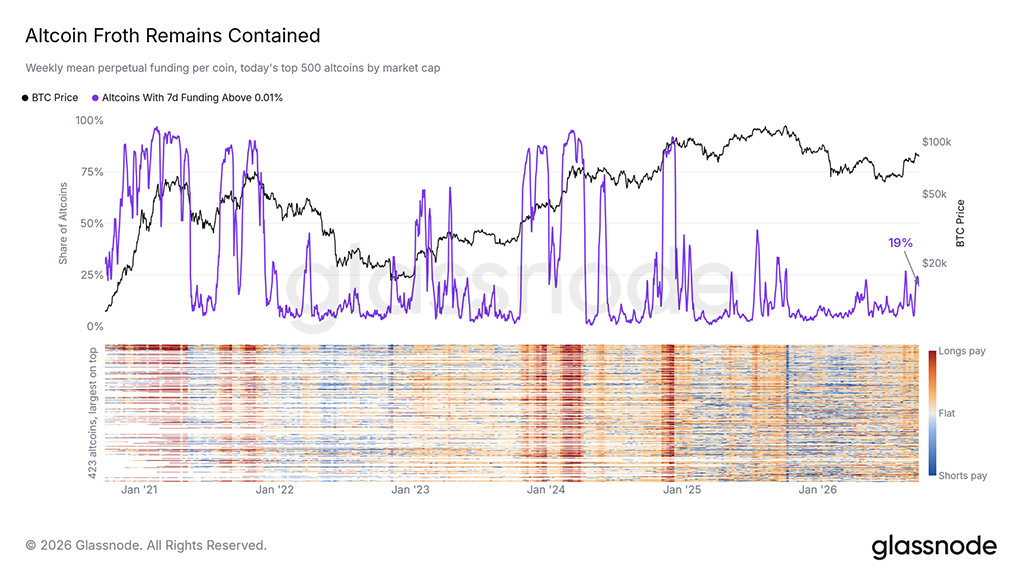
Over the past month, altcoins outperformed bitcoin: most of the 500 largest cryptocurrencies rose more than bitcoin over 30 days. This week, growth slowed: 6% of altcoins hit a 30-day high, compared with 49% on 22 September.
Throughout the move, leverage remained moderate. Perpetual futures funding shows which side pays to hold its positions, and a high share of coins paying above the neutral rate of 0.01% signals crowded long positions. Today, only 19% of altcoins pay above that rate, well below the share at each of the past altcoin peaks in the chart.
Altcoin holders have been able to recover from losses
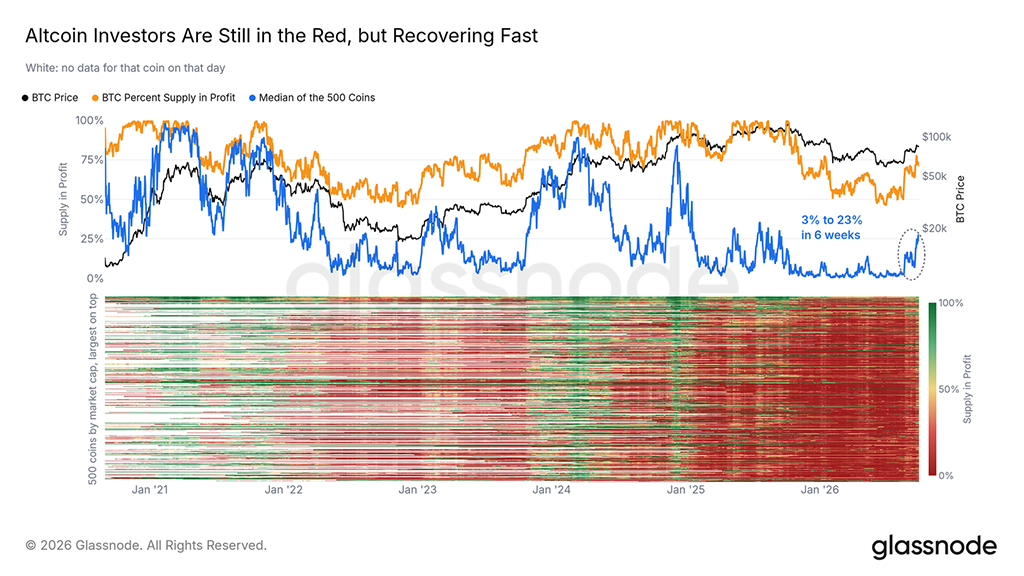
Rising prices are helping altcoin holders climb out of deep losses. For the median altcoin, the percentage in profit from listing rose from 3% in mid-August to 23%, the sharpest increase in more than a year.
Most altcoin holders are still at a loss, far from the overall profit seen at the peaks of 2021 and 2024. If the median exceeds half, it will indicate that the recovery has reached most holders.
The number of positions has not increased
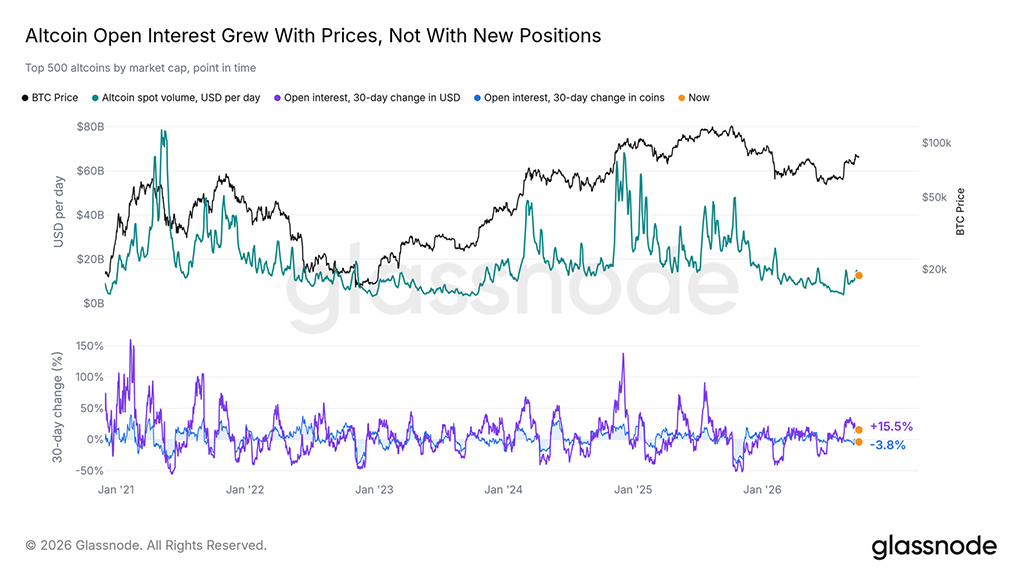
Open interest confirms this trend. The value of open positions in altcoin perpetual futures has risen in dollar terms over the last 30 days but has fallen in coin terms: the growth is driven by higher prices, and traders have not opened new positions. Spot altcoin trading volume, shown in the top chart, has increased since August but remains well below the peaks of 2024 and 2025.
As long as positions are not being built up in dollar terms, the risk of forced liquidation remains low.
Conclusion
Bitcoin is in the early stage of an uptrend that has not yet attracted broad participation: on-chain support persists, but demand for ETF has declined, and spot volume remains low. The short-term test is the wall of offers above the price. A breakout above it with rising volume and a resumption of inflows into ETF would confirm an expansion of the uptrend. More active selling by long-term holders at a stable price, or a daily candle close below the true market average of $77200, would weaken it. Altcoins have joined the rally without new leverage, which limits the risk of forced position liquidation.
See also: