In This Article

Bitcoin (BTC) crossed the $85000 dollar mark on light trading volume and a modest inflow of new funds, then declined again. Options traders are optimistic, liquidation levels are building up below the price, and altcoins look overvalued.
Original Glassnode report (in English).
Introductory Summary
- BTC trading volume remains unusually low, and the inflow of new funds is less than two-fifths of the growth in actual capitalization.
- Recent buyers took profit into Sunday's close above the $85000 mark, producing the largest inflow of funds to exchanges in a year.
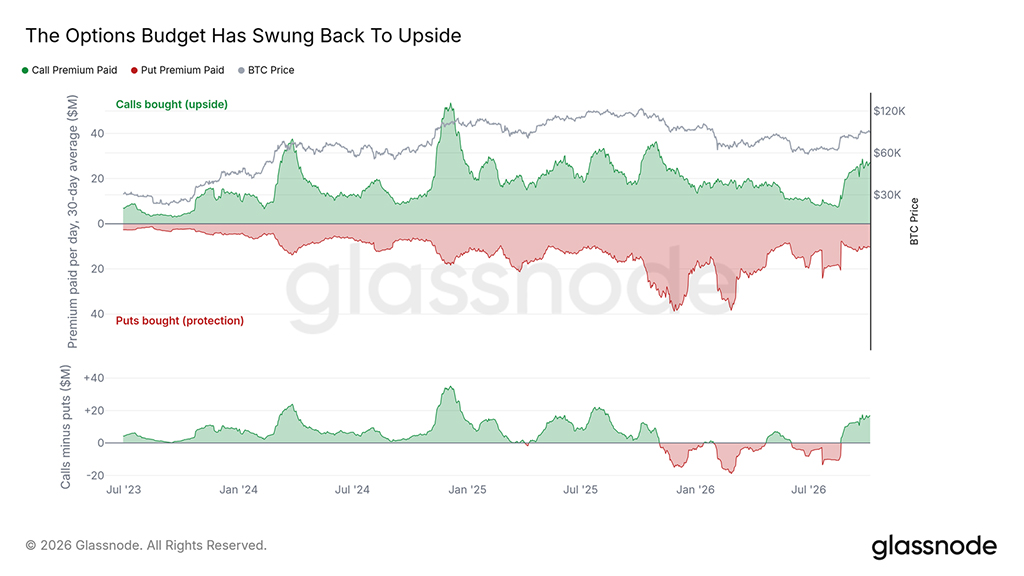
- Options traders are leaning bullish again: the put-to-call ratio for 2026 remains low, and spending on call options now significantly exceeds spending on put options.
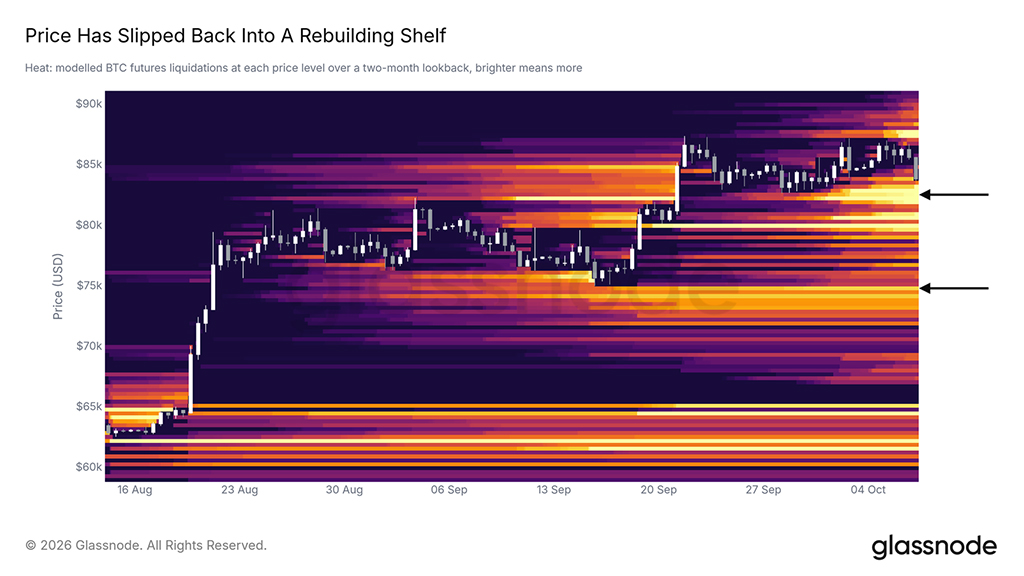
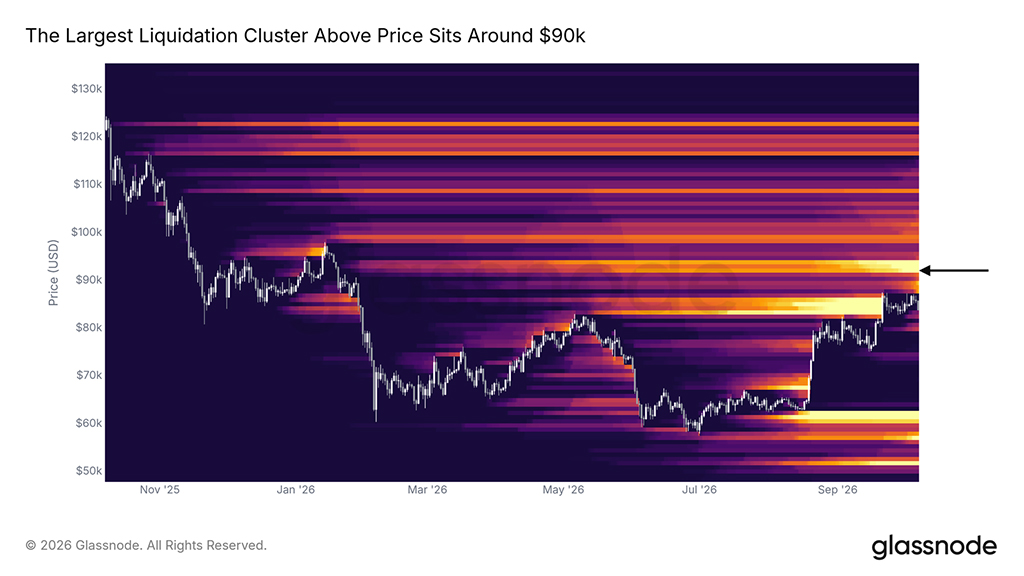
- Most liquidation levels are below the price; the nearest sits at $81700–$83300, but the largest single cluster on the one-year map is above, around $92000.
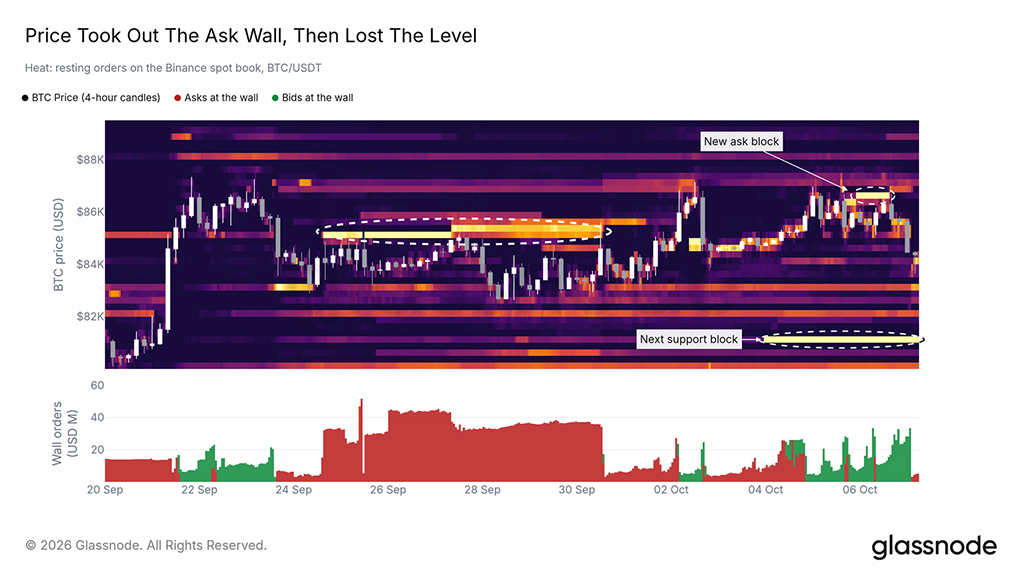
- Sellers continue to place blocks of offers above the price, and the largest orders on the Binance exchange stand at $81000.
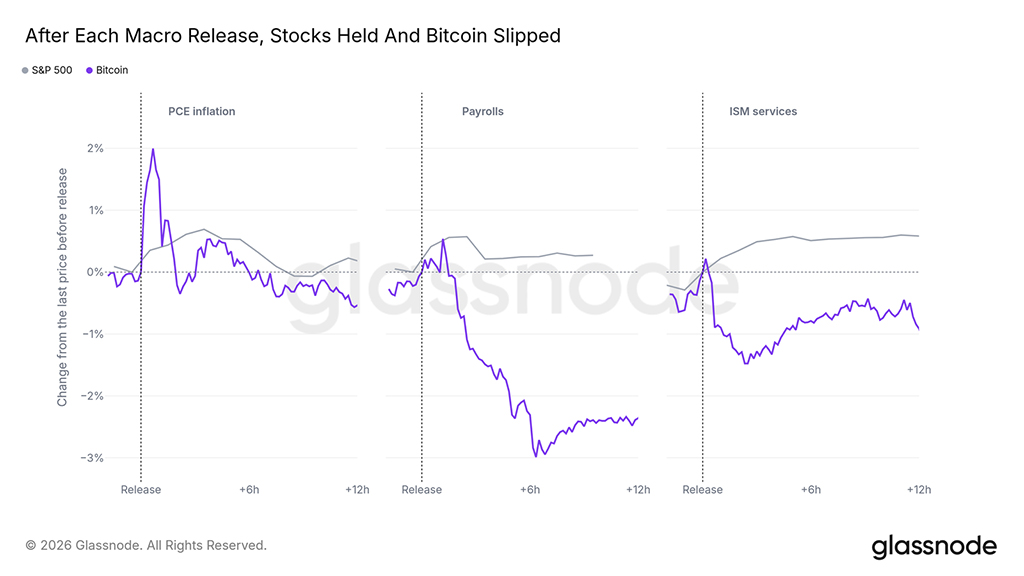
- This week, the release of every statistical report from the US led to a decline in the bitcoin price, while stocks remained flat, and the American session turned into a net session oriented toward selling.
- In late September, altcoins were outpacing bitcoin, but now their leverage looks excessive, and the market has begun to lag.
Running on Low Volume
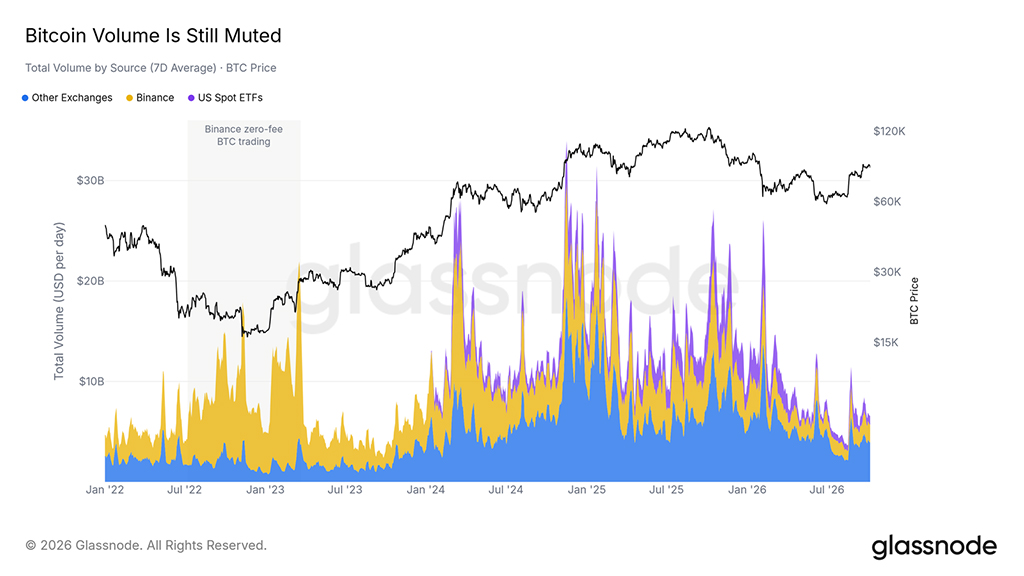
Total bitcoin trading volume, including spot exchanges and US spot ETF, averages about $6.8 billion per day on a weekly average. This is lower than on nine out of ten days since January 2024, and significantly below the peaks of the last two years.
Crossing the $85000 mark did not change the situation. Not a single day since 22 September reached the usual trading volume for its day of the week, and Sunday's close above this level came on volume roughly half that of a typical Sunday. A rise in trading volume would be the first sign that buyers were becoming active again.
New Money Is Coming In Slowly
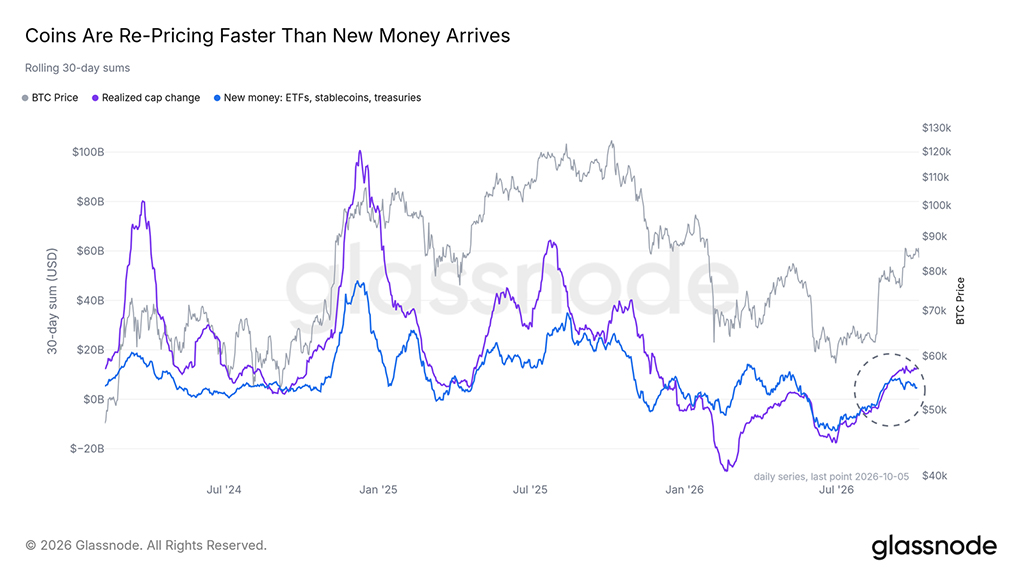
Over the 30 days leading up to 5 October, inflows into US spot ETF, stablecoin growth, and corporate treasury purchases brought in about $4.9 billion dollars. Over the same period, realized capitalization (the actual value of all coins at the price at which they last changed hands) rose by approximately $12.8 billion.
Thus, new money covers less than two-fifths of this growth. The rest is coins changing hands at higher prices among money already on the market. The 2024 and 2025 rallies showed a similar structure, but with a much larger inflow of funds. Until this inflow increases, the movement depends on how much more existing holders are willing to pay.
Recent Buyers Took Profit
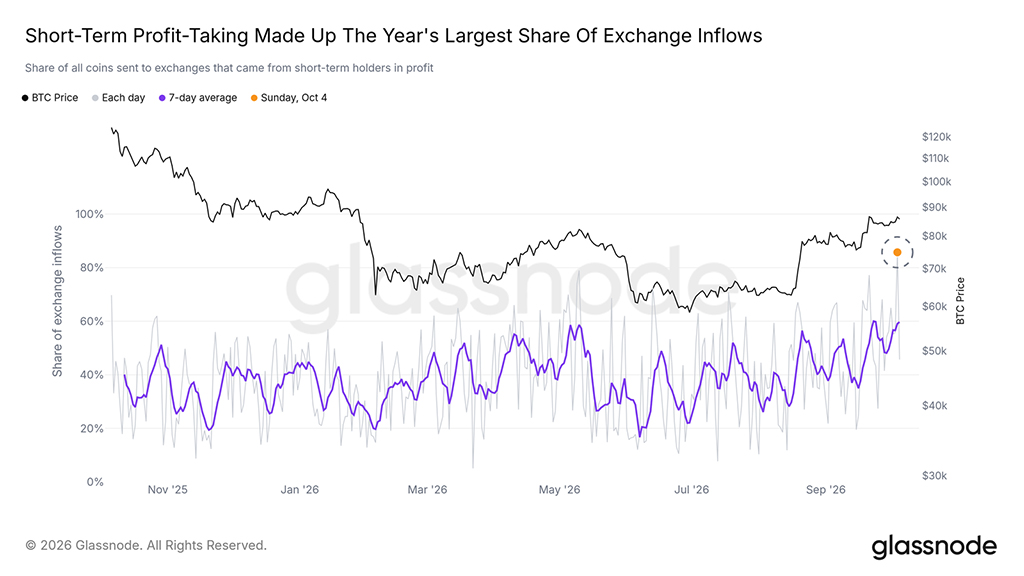
On Sunday, 4 October, the price closed above the $85000 mark for the first time in a day, after which ETF were closed for the weekend. It was also a day of active profit-taking. Of all the coins sent to exchanges that day, about 86% came from short-term holders — that is, those who had owned the coins for less than 155 days — trading at a profit. This is the highest share for any day in the past year; on a typical day it is less than two-fifths.
The sellers who met the breakout were buyers from the past few months. If they continue sending coins to exchanges at the same rate, the next push toward the $85000 mark will meet the same supply.
Options Lean Bullish
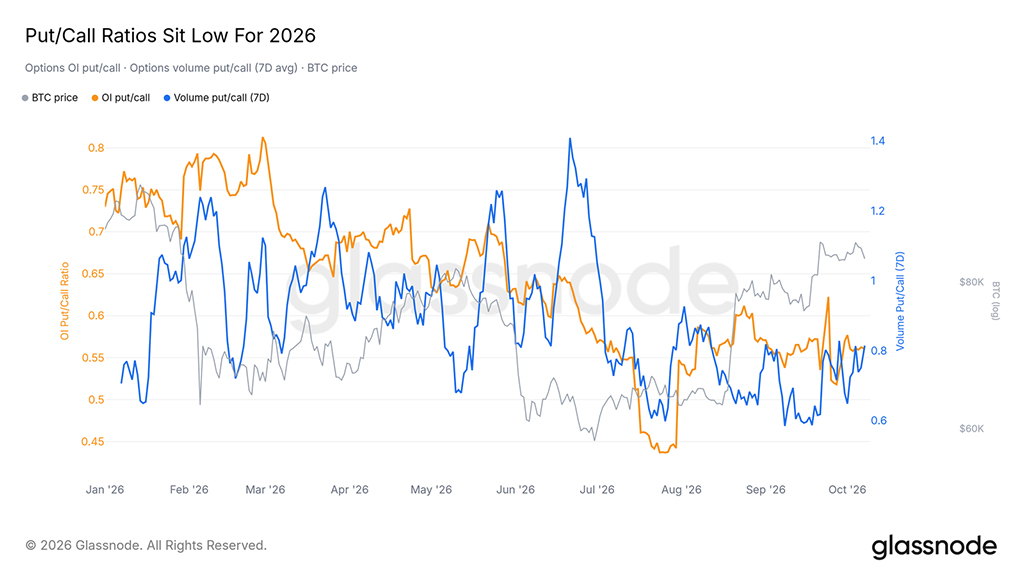
The options market is showing a bullish trend again. The put-to-call ratio, both in open interest and in trading volume, is below one and in the lower third of the 2026 ranges. In open interest, there are now approximately 0.56 put options for every call.
Paying for Upside
Similarly, the premiums paid by traders show up elsewhere as well. For most of the past year, traders spent more on put options than on call options: puts led on 234 of the last 365 days. Since mid-August, that has changed. Averaged over 30 days, traders now spend about 17 million dollars per day more on call options than on put options, roughly half of the largest gap on the chart.
This is nascent optimism that could turn into an excess of capital if the price stalls and traders keep paying for potential upside. History offers no clear direction: in 13 instances since 2020 when short-term call options were this expensive relative to puts and volatility this low, bitcoin showed a higher price a month later in 7 cases.
A Pile of Liquidations Below
Liquidation levels are accumulating below the price. On the two-month liquidation heatmap, which models where leveraged futures positions would be forced to close, only about 17% of levels are above the current price. Over the week, the area occupied by the price roughly doubled.
The nearest large cluster sits right below the price, roughly between $81700 and $83300. A second cluster is located near $75000, and the largest of all sits much lower, at $60000–$63000. If the price falls to these clusters, forced selling of long positions could amplify the move.
The Largest Buildup Is Above
The one-year map shows the other side of the coin. The largest single cluster above the price range extends roughly from $87100 to $95900 and is most concentrated around $92000. Half of this cluster formed since late March, when short positions piled up above this range.
If the price breaks through the supply level at $86500, forced closing of these short positions could fuel further gains. Until then, the nearest buildups of positions below the price will matter more.
Last week, this report described a wave of sell orders at $85000–$85500 on the Binance spot market. Buyers bought up these assets on 30 September, and on 4 and 5 October the price closed above $85000.
Sellers then placed a new block of orders at $86500–$86750. The price fell back below this level on 6 October, and early on the morning of 7 October it broke through the accumulated orders at $85000. The largest block of orders now sits at $81000–$81250 and has been holding since 3 October. Given the buildup of sell orders just above this level, $81000 is the key level to watch if the decline continues. A close above $85500 would restore the level the market lost this week.
The Macro Effect Provides No Lift
US data did not help bitcoin this week. All three releases followed the same pattern: an initial rise, then a decline over twelve hours, while the S&P 500 stayed above its pre-release level each time. After the PCE inflation data release, bitcoin lost its initial jump, down 2%. After the employment data release on 2 October, twelve hours later it was down 2.3%.
The next test will be the consumer price index release on 14 October. The minutes of the latest FOMC meeting are due late in the evening on 7 October, after the data releases in this issue.
Selling in the American Session
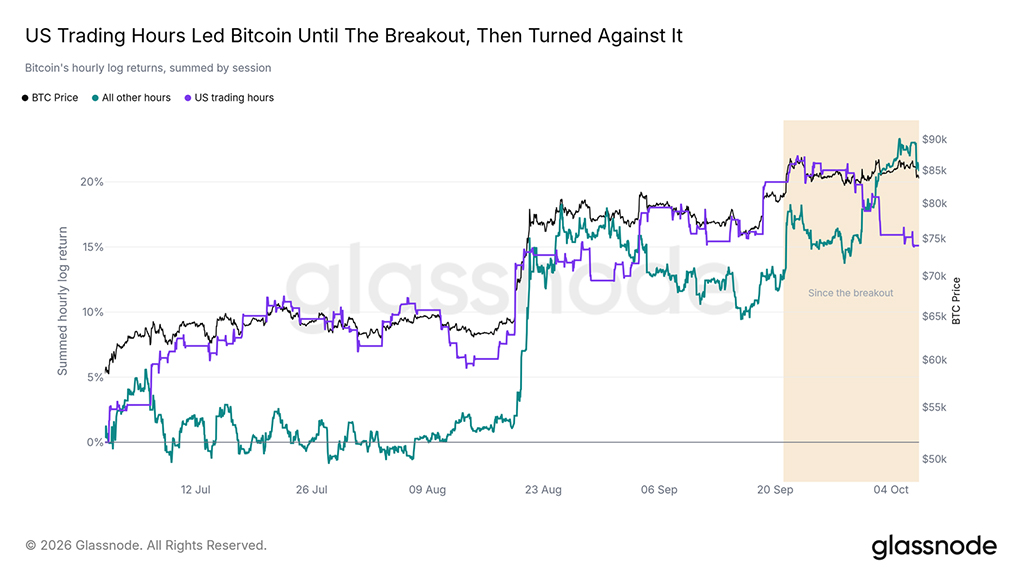
Trading hours show the same weakness. From July until the 21 September breakout, bitcoin posted most of its gains during American trading hours. After the breakout, the American session was characterized by net selling, and all of bitcoin's net gains came during the rest of the day, including the weekend, when Sunday's close exceeded $85000.
ETF and stock market trading take place during US-set hours. Until this session starts producing gains, growth depends on reduced activity during overnight and weekend trading.
Altcoins Rise First, Then Fall Behind
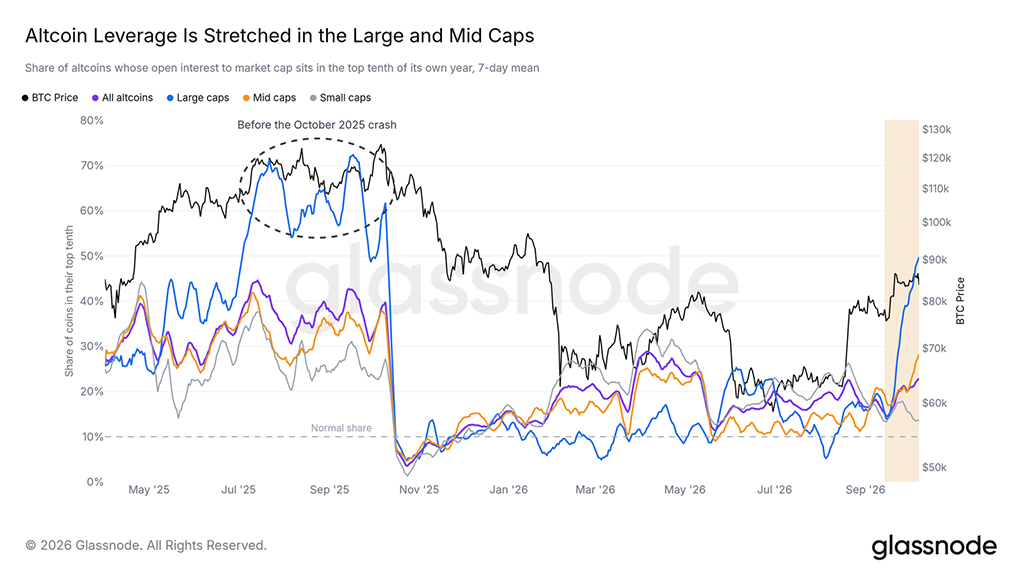
Altcoins showed strong gains through the end of September. In each of the two weeks prior, roughly seven out of ten outpaced bitcoin. In the most recent week, that figure fell to fewer than three out of ten.
The leverage accumulated over this time has not yet been exhausted. A growing share of major altcoins has open interest significantly exceeding their market capitalization when compared to each coin's figures over the past year. This share is now the highest since the October 2025 crash, and mid-cap coins are also overvalued. Part of the growth is driven by falling prices while positions remain open. If prices keep falling with positions open, forced liquidation may follow.
The Field Falls Behind
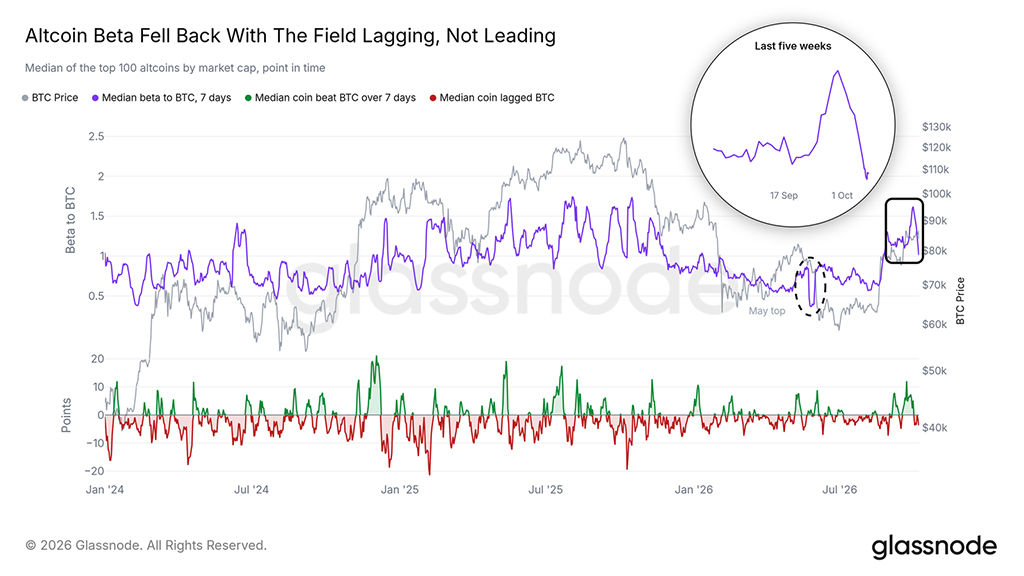
The altcoin beta confirms the reversal. Last week, the median altcoin amplified bitcoin's moves. Since then, its beta — which shows how much it moves for every move in bitcoin — has fallen to near one, and the median altcoin now lags bitcoin.
With beta near one, a further drop in bitcoin will deal the whole exchange at least as strong a blow. If the number of coins outpacing bitcoin rises again with a growing beta, it will signal a resumption of rotation.
Conclusion
Bitcoin spent the week around the $85000 mark, without the trading volume, new investment, or American-session demand needed for a sustained breakout. Recent buyers sold into the rally, options traders turned optimistic, and liquidation and buy-order levels moved lower. The market now relies more on positioning than on new demand.
An increase in spot volume and ETF purchases, along with a close above $85500, would show that the breakout has real support and would bring the $92000 cluster closer to its target. A break below $81000 would trigger the liquidation clusters below that level, and given the excessive leverage in altcoins, the market as a whole would feel it too.
See also: