In This Article

On 15 October, bitcoin soared to a level around $80000, landing just below the cost basis of U.S. spot ETF and corporate treasuries, and within days demand for it picked up again. Above this level, the 6–12-month cost basis, the offer block, and the largest liquidation clusters sit in the range from $85000 to $87500.
The original Glassnode report (in English).
Introductory Summary
- On 5 October, bitcoin soared to roughly $80000, landing just below the base levels of ETF and corporate treasuries, and within days demand for it picked up again.
- The price noted above, the 6–12-month cost basis, the order block, and the largest liquidation-asset clusters sit in a range of roughly $85000 to $87500.
- On 19 October, ETF attracted $653 million at low trading volume, and profit-taking slowed roughly by half compared with the September peak.
- Next comes the Fed's decision on 28 October and the list of companies removed from MSCI indices on 11 November, which could include Strategy.
- Altcoin froth and funding volumes have declined from their peaks, though open positions have shrunk only slightly.
Cost-Basis Cleanup
Last week, this report identified the average price that U.S. spot ETF paid for the coins they hold as the nearest support level on the blockchain. Bitcoin traded around this line from 8 October and dipped below it several times. The deepest drop came on 15 October, when the closing price on the hourly chart fell to $80100, and on the next hourly chart the closing price was back above this line.
In spring, this same level capped Bitcoin's rise. In early May, the price got stuck just below it and did not close above it for a single hour until 3 September. In October, it acted as support. The true market-wide average, the average purchase cost for active investors, sits lower, around $77600, and the rise stopped well below this level.
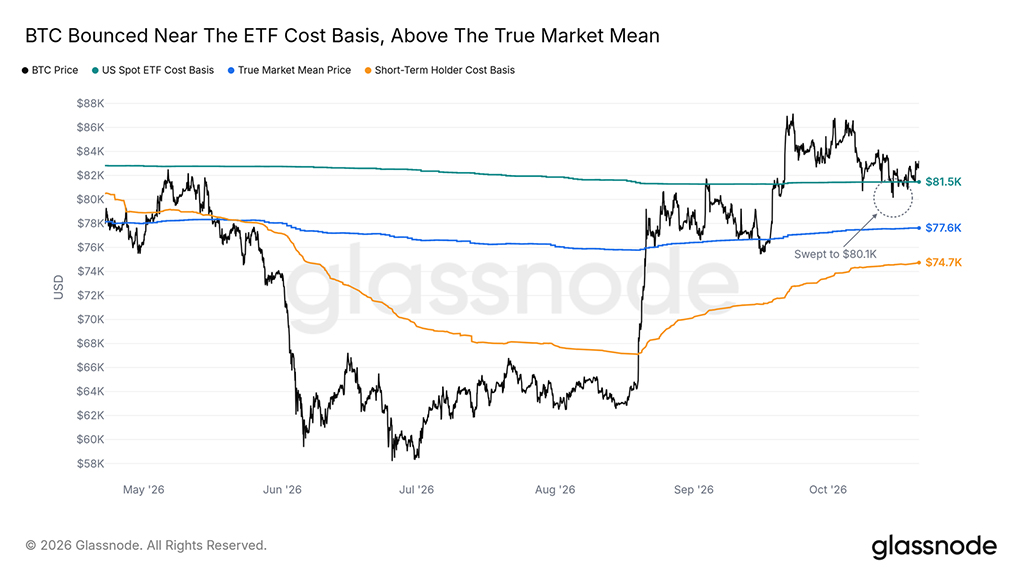
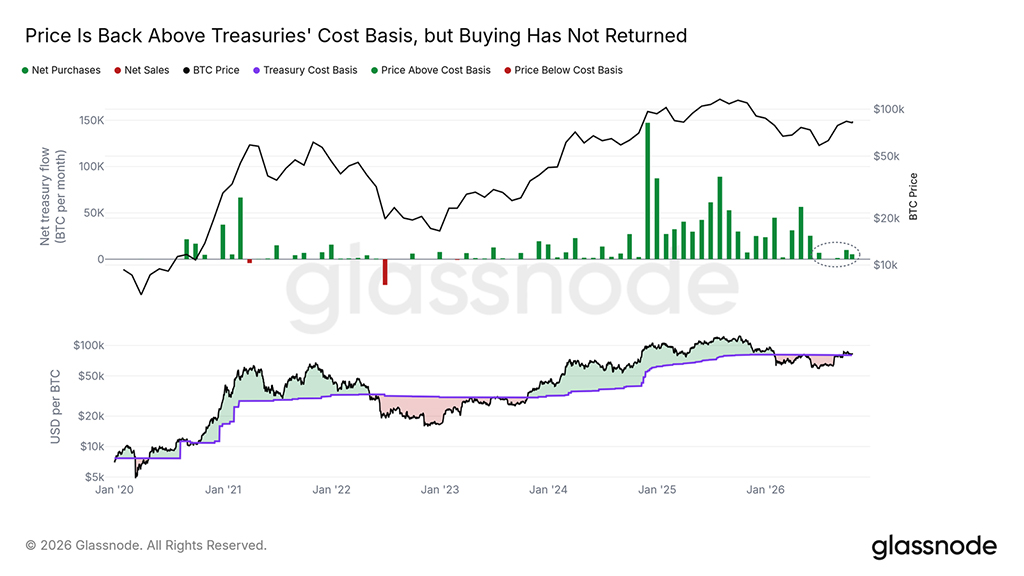
By our estimates, based on the size of their assets and unrealized profit, the treasury-managing companies we track hold their bitcoins at an average level of around $80200, slightly below the ETF level. For most of this year, the price stayed below this level, falling by more than a quarter by late June, and has closed above it every day since 18 September.
The price rise was not accompanied by an increase in purchase volume. Every month since June, the company has added less than one tenth of the peak value in November 2024. With both cost bases between $80000 and $81500, the sharp price drop on 15 October became a test for the two largest holder groups at once. A close below $80000 would on average put both groups underwater.
Orders Reappear at the $80000 Level
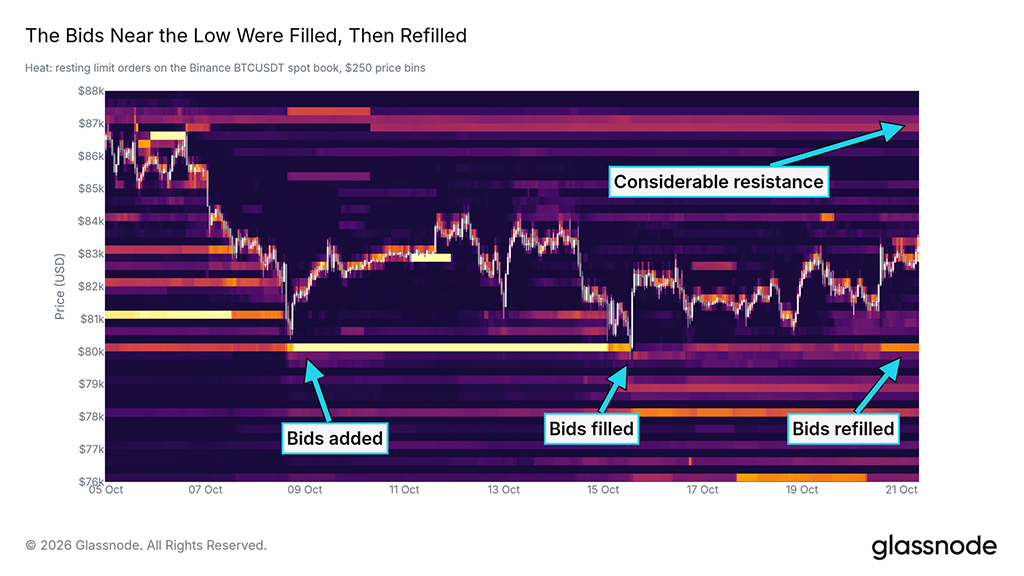
The largest order block on the spot market of Binance, noted here last week, stood at $80000, just below the ETF level. During trading on 15 October, most of the block was filled. The bids returned by 20 October. They are smaller than at the peak, but buyers still want to acquire bitcoin at this price.
Above the price level, the main offer block sits in the range from $86500 to $87500, which is the first strong resistance level in the order book.
Clusters Shift Above the Price Level
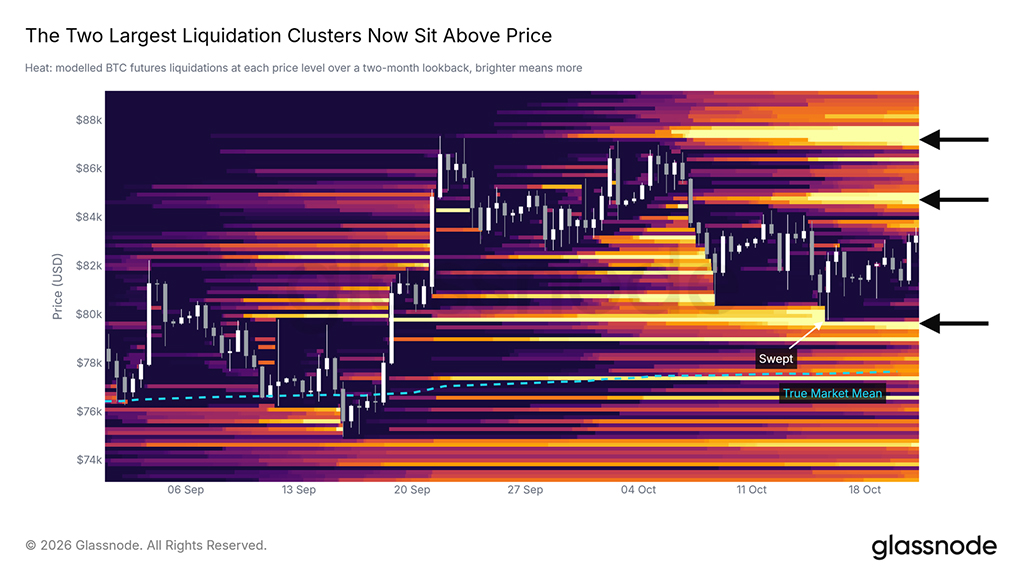
The liquidation heatmap models the prices at which leveraged futures positions would be forced to close. As a result of the 15 October events, a clear band of prices crossed the level around $80000, and the two largest clusters are now above the price, around $85000 and $87000. Below the price, a clear line remains around $79600, just below the 15 October low.
A move toward the $87000 mark could accelerate as short positions are closed, but at that point the price would match the requirements of the order book.
Still Among the Best Buyers
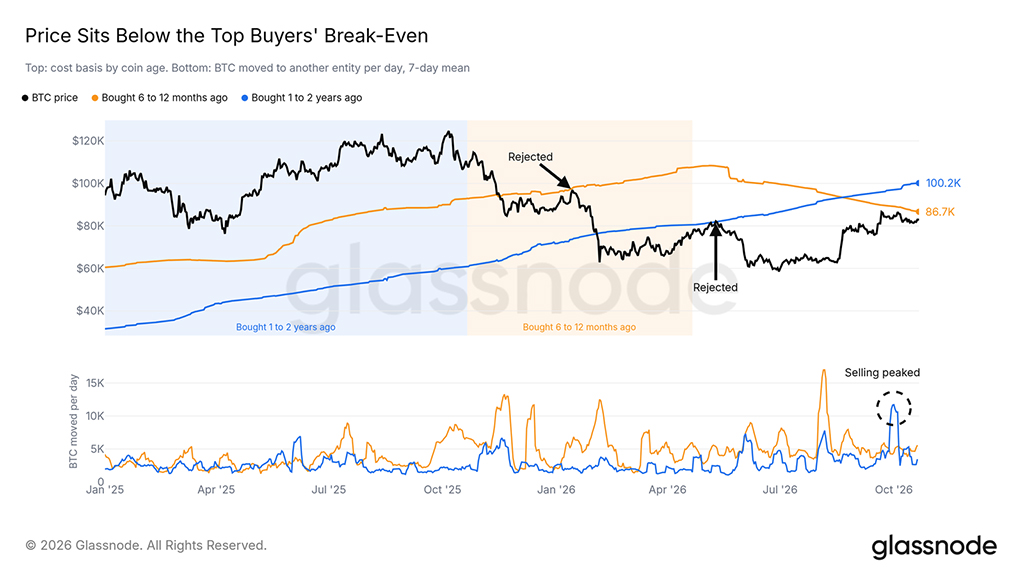
Last week, this report described bitcoin as being within the cost basis set by buyers over the past two years. This ceiling still holds. The cost of coins bought 6–12 months ago now stands around $86700, below the $88000 we mentioned last week, while coins bought 1–2 years ago sit around $100000. The first of these lines now lies in the demand zone and the liquidation clusters around $87000.
Selling by these holders has declined. The peak in selling by the group of holders owning coins for 1–2 years came in early October, after the September high, and this group now sells less than a third of its coins per day.
A daily close above $86700 would on average bring back buyers willing to buy in and allow the nearest supply shortfall to be overcome.
Inflows Return at Low Volume
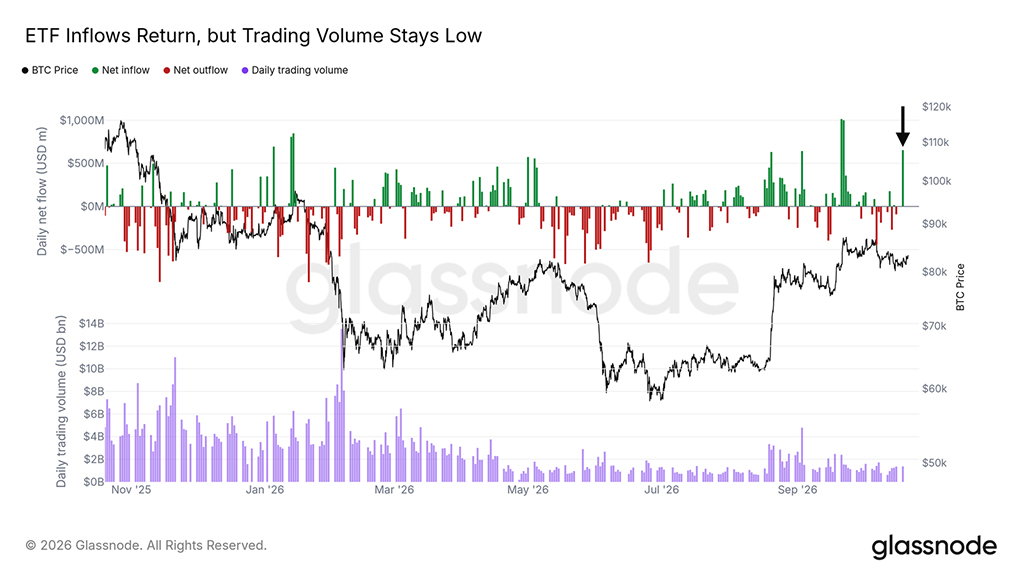
After a week of net outflows, U.S. spot ETF on Monday, 19 October, attracted about $653 million, the largest figure since 22 September. This again put weekly fund flows in positive territory.
Trading volume does not match expectations. On that day, the funds traded less than on an ordinary day last year, and their average volume over 30 days is less than a quarter of last year's level.
Repeated inflows at rising volume would indicate that demand is extending beyond a single day.
Profit-Taking Slows
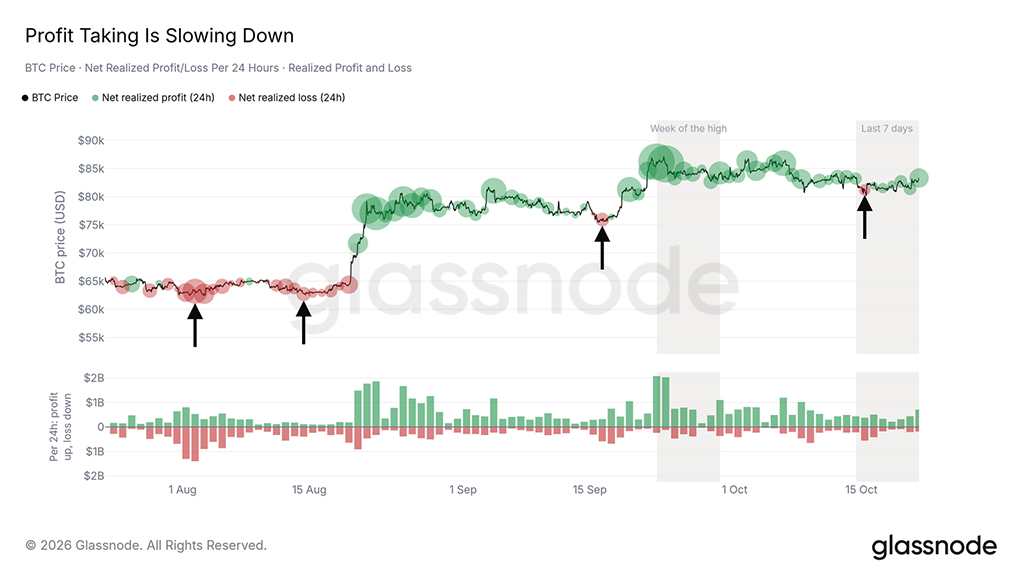
On the blockchain, holders are locking in less profit. Realized profit — that is, profit locked in when coins move above the price of their last move — has fallen roughly by half over the past week compared with the week the September high was reached. Realized losses remain stable, and the largest loss over the past week came in the 24 hours before the morning of 15 October, when the price approached the $80000 mark.
A resumption of profit-taking near the $87000 mark would be the first sign that sellers have returned to the upper boundary of the range.
MSCI Sets the Date
On 15 October, after the U.S. market close, MSCI adopted new rules for so-called non-operating companies. A test run based on May data, published along with the consultation in August, identified Strategy and Metaplanet among them. A company already included in MSCI indices is removed from them only if it fails the test in both of the last two annual reporting periods. MSCI will publish the final list on 11 November, with the changes taking effect at the close of trading on 30 November.
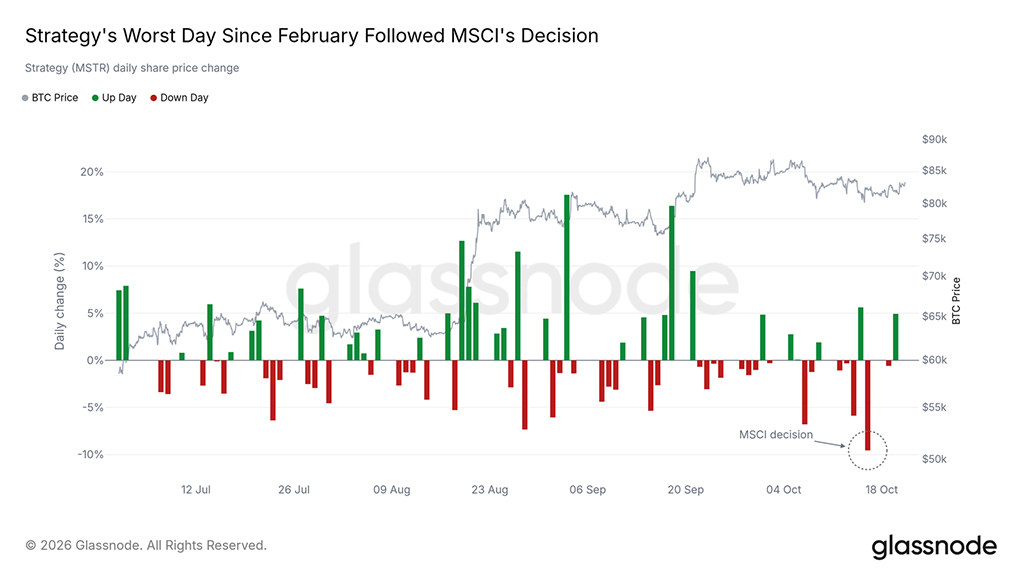
Strategy shares fell almost 10% on 16 October, in the first trading session after the decision, and it was the worst day since February. Bitcoin barely moved that day.
Removing Strategy from the 11 November list would force funds tracking MSCI indices to sell the company's shares at a time when treasury companies are already buying far less bitcoin. If Strategy appears on the 11 November list, its shares will come under pressure first, and the next question will be whether it continues buying bitcoin.
Oil Prices and Bond Yields Rise, Data Goes to the Fed
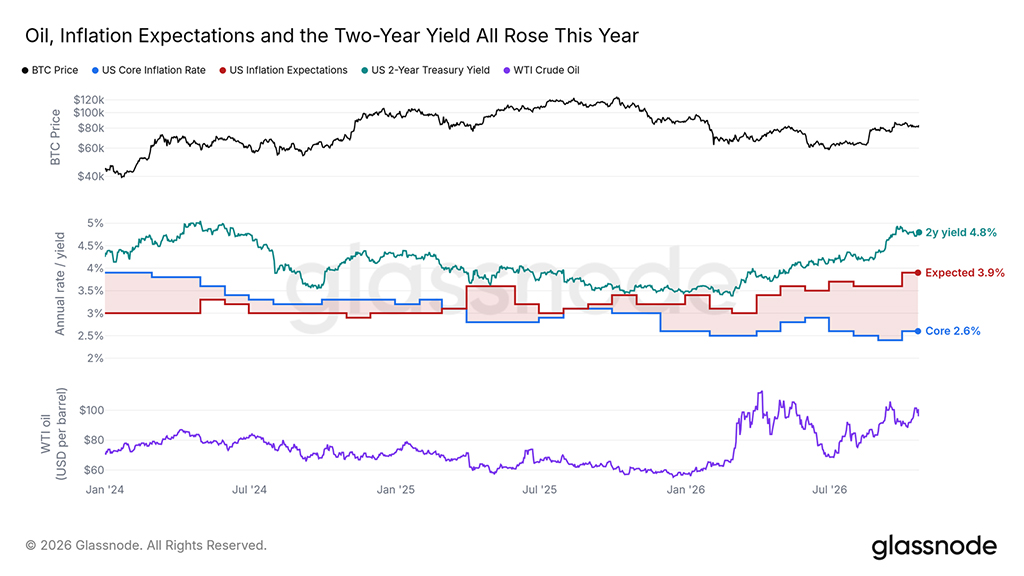
The Federal Reserve will make its interest rate decision on 28 October. Since the start of the year, the price of WTI crude has risen about 73%, and households' inflation expectations have increased by half a percentage point. Core inflation has remained at the same level as at the start of the year, but the September consumer price index, which we wrote about last week, came in above forecasts for both the headline year-over-year rate and the core rate.
Yields have risen as well. The yield on two-year Treasury notes, which tracks traders' expectations for further changes in interest rates, has risen more than one percentage point this year, reaching 4.8%. It now far exceeds the upper bound of the Fed's 4% target range, even after the 16 September rate hike.
Since that price increase, bitcoin has risen about 10%. If oil prices continue to push inflation expectations upward, ruling out a second price increase will be harder.
Metals Cool Off, Bitcoin Leads
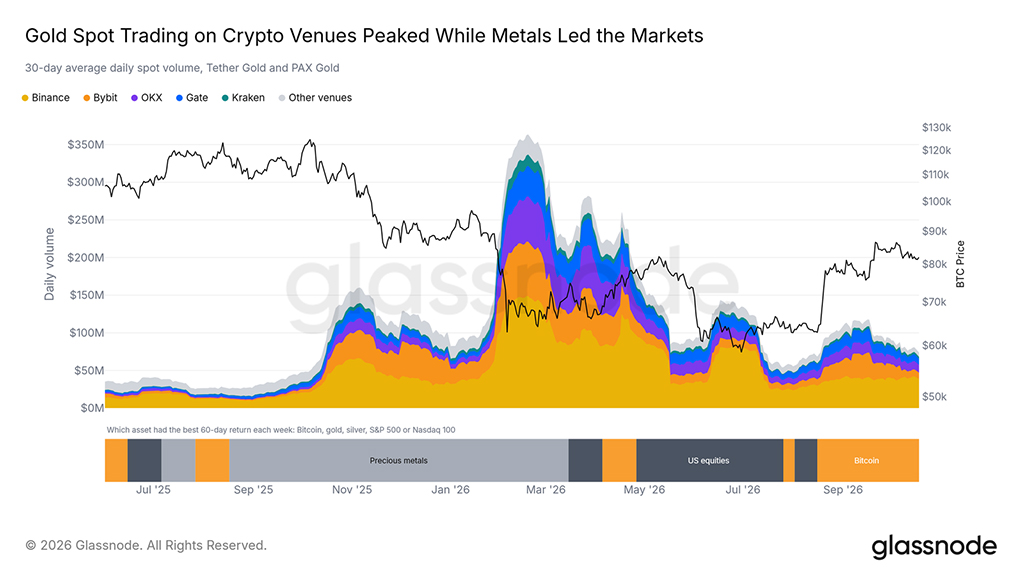
This year, market leadership has passed from metals to stocks, and then to bitcoin. Judging by the two-month returns of bitcoin, gold, silver, the S&P 500 and Nasdaq 100, gold and silver led in the first quarter, while U.S. stocks led in spring and in July. Bitcoin has led for the last 10 weeks.
Crypto exchanges traded in step with the rise in metal prices as it unfolded. Spot trading volume in tokenized gold (Tether Gold and PAX Gold, tokens backed by physical gold) peaked in mid-February, when precious metals were leading, and then fell to 15% of that level by the end of July. By mid-September it had more than doubled, with bitcoin leading, and then declined to 20% of the February peak.
Binance still controls the largest share of this trading. OKX and Gate have increased their share this year, with Gate's share growing from 0.6% in 2024 to 12% so far in 2026.
If precious metals take the lead again, February's dynamics suggest that gold trading on these exchanges will grow along with them.
Positions Held Longer Than the Trade Itself
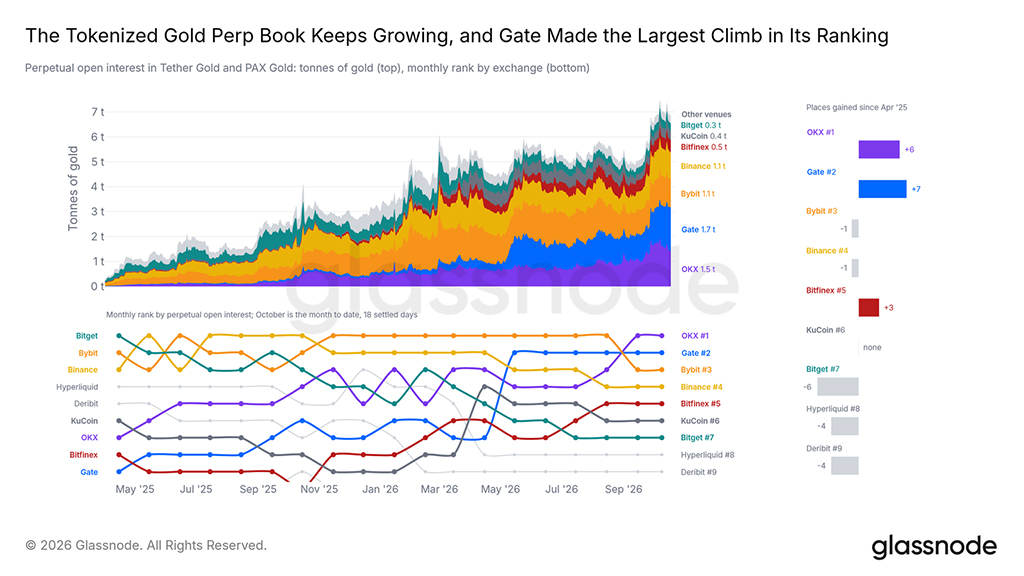
Traders kept their gold positions after trading peaked. Open interest in perpetual futures on tokenized gold — the volume of all open futures contracts with no expiration date — currently stands at 7.0 tonnes of gold, 62% more than at the February peak in spot trading. The volume of orders rose from 5.0 tonnes in mid-September, while spot trading declined, indicating that traders are holding their gold positions longer.
This year, the Gate exchange has increased its trading volume more than any other: 42% net growth since 1 January. Since April 2025, it has also made the biggest jump in the open-interest ranking, from 9th to 2nd place; OKX, which holds first place on the October average, rose 6 positions. On average over the past week, Gate's trading volume is the largest among the exchanges tracked by Glassnode: 1.7 tonnes versus 1.5 tonnes at OKX.
Sustained gold holdings above 6 tonnes, assuming metals no longer lead, would indicate that traders are keeping gold positions on crypto exchanges even without a subsequent rise in metal prices.
Most Exchanges Hold Less
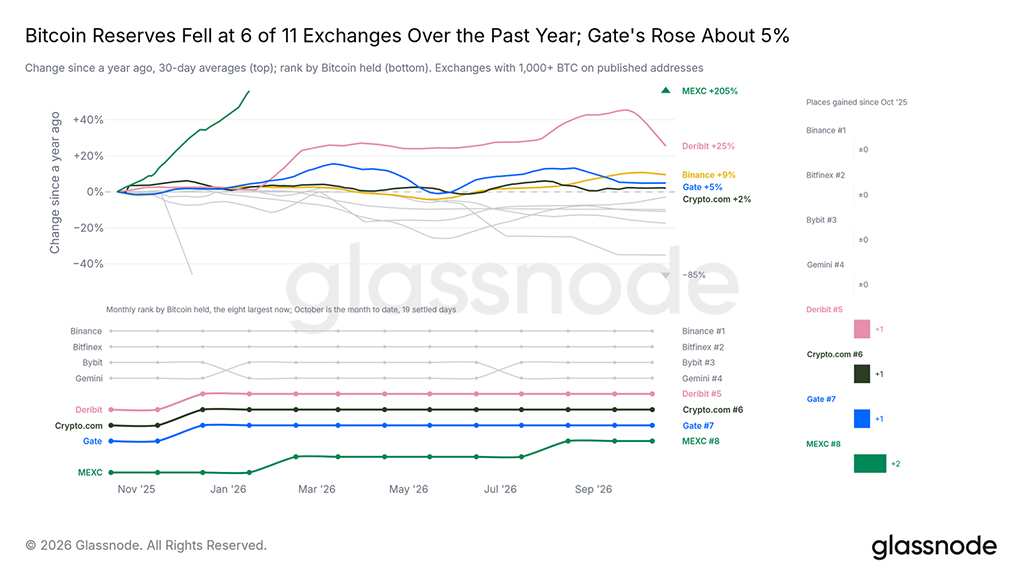
Over the past year, bitcoin reserves at most exchanges have shrunk significantly. Our Proof of Reserves metric tracks the addresses that exchanges publish to show how much bitcoin they hold. Among the 11 exchanges holding at least 1000 BTC on these addresses, six had smaller reserves than a year ago. Of the five exchanges whose reserves grew, Deribit posted one of the fastest results. Gate's reserves grew 4.9%, while the median across the other ten exchanges fell 6.4%.
The decline continued into spring. At the end of November, four of these exchanges held less bitcoin than in October of last year; by the end of May, eight did, and now six do. Growth at the largest exchange prevented a drop in the total, but across the other ten exchanges combined, roughly 10% less is held than a year ago.
This week, Gate published its latest Proof of Reserves report, which compares the exchange's reserves with its users' deposits. As of 18 October, the exchange reported reserves of roughly 1.4 billion dollars more than its users hold. The share of Bitcoin, Ethereum, stablecoins, and all other major assets mentioned in the report exceeds 100%.
If prices keep falling, the bitcoin remaining on exchanges will concentrate among the few that are still topping up their reserves.
Altcoin Leverage Declines
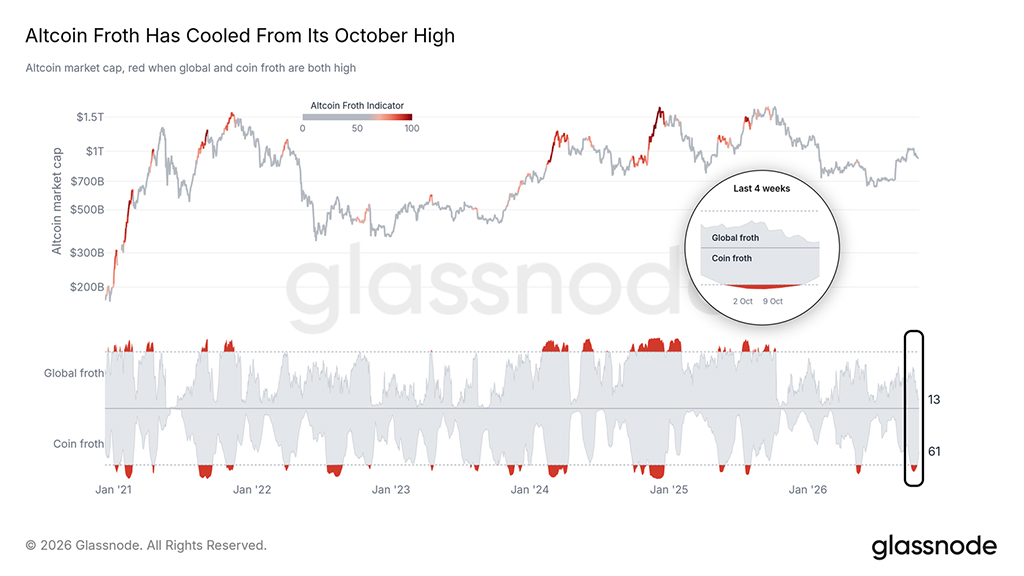
In the previous issue, we drew attention to excessive leverage within individual altcoins: the "Cuban bubble" metric, which tracks how many altcoins carry high leverage relative to their own past performance, was in the upper zone. Bitcoin fell to the $80000 level on 15 October, and over the following weekend the median altcoin dropped about 4%, the biggest weekend drop since May.
The peak in altcoin market activity came on 7 October, after which it declined. Global market activity, a similar test applied to the altcoin market as a whole, remained below its peak and has continued to fall since.
Funding Rate Near Its Low Again
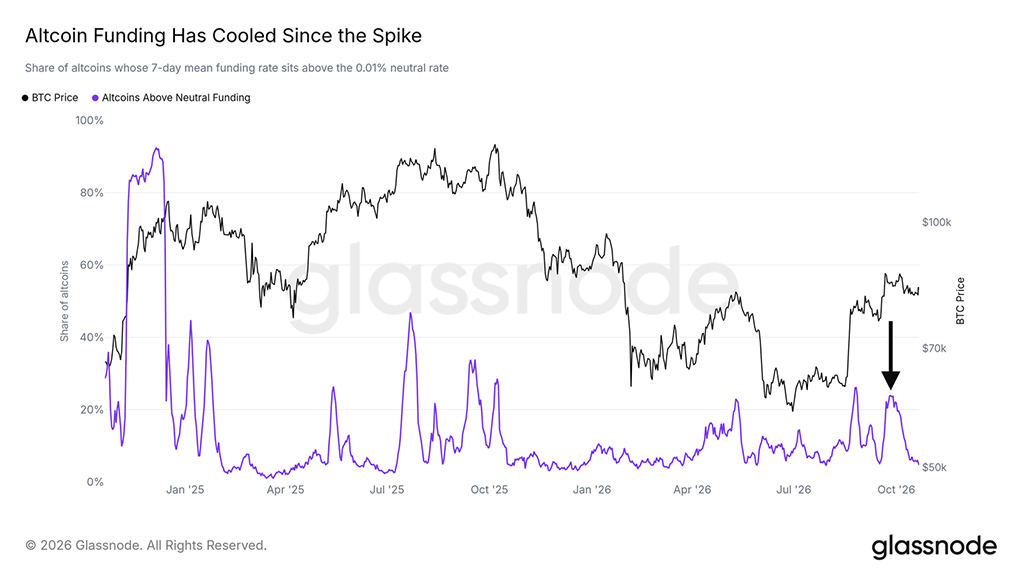
Funding rates show a similar decline. Funding is the fee that long perpetual futures holders pay to short positions when demand for leverage spikes. At the end of September, nearly a quarter of altcoins were paying above the neutral rate. Now fewer than 5% do, which is near the lower boundary of the two-year range.
It is worth noting that open positions are only about 5% below their October peak in constant prices. Since most of the leverage is still open, a resumption of funding growth would be the first sign of a new market froth.
Conclusion
Bitcoin remains in a tight spot. During the 15 October crash, buyers were drawn in at prices matching the base levels of ETF and corporate treasuries in the range from $80000 to $81500, and profit-taking has slowed since. The base levels, purchase prices over 6–12 months, the offer block, and the largest liquidation clusters sit in a range of roughly $85000 to $87500.
A daily close above $87500, with inflows into ETF repeating at rising trading volume, would show that demand is absorbing supply. A daily close below $80000 would put the average holder of ETF and corporate treasuries at a loss and would reveal the true market-wide average around $77600. The Fed will decide on 28 October, and the MSCI list comes on 11 November.
See also: