What does the Bitcoin dominance chart show?
Bitcoin dominance measures the leading cryptocurrency’s percentage share of total cryptocurrency market capitalization. It shows the relative size of Bitcoin (BTC) compared with the entire crypto market at a given time. The chart cannot provide a completely accurate picture because some coins are considered lost but remain included in the calculation. Nevertheless, many financial analysts use this metric in their analysis.
Bitcoin dominance chart (BTC.D)
The BTC.D chart shows Bitcoin’s share of the cryptocurrency market.
How is Bitcoin dominance calculated (BTC.D formula)?
The Bitcoin dominance formula is straightforward and contains only two variables: BTC.D = MarketCap.Total / MarketCap.BTC * 100, where:
- MarketCap.Total is the total capitalization of the cryptocurrency market (calculated using the combined market capitalization of the 125 largest cryptocurrencies).
- MarketCap.BTC is Bitcoin’s market capitalization, equal to the BTC price multiplied by the total number of BTC available on the market (this figure is not exact, as it includes all coins ever issued without excluding permanently lost coins).
Bitcoin market capitalization chart (MarketCap.BTC)
The MarketCap.BTC chart shows the combined value of all BTC available on the market.
BTC.D history and trends in recent years
The BTC.D (BTC.Dominance) chart dates back to 31 March 2014, when it was first launched by TradingView, the popular online analytics service and social network for traders. Bitcoin dominance was then at its peak of 99.41%, reflecting the lack of competition from alternative cryptocurrencies.
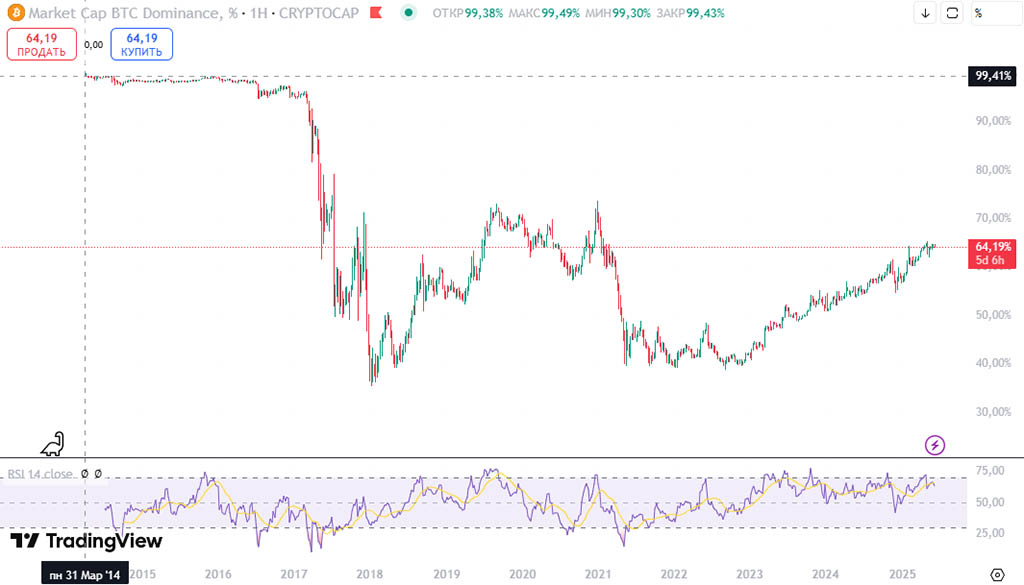
For many years after the chart launched, the emergence of numerous alternative cryptocurrencies (altcoins) weighed on BTC dominance and significantly reduced the leading cryptocurrency’s market share.
Despite the long-term downward trend in BTC.D, Bitcoin remains the leading cryptocurrency by market capitalization, trading volume and liquidity depth, and is unlikely to lose its position to another cryptocurrency in the coming years. This is because most retail and institutional investors regard Bitcoin as “digital gold” due to its limited maximum supply.
At the time of publication, BTC.D had recorded two major declines in which the leading cryptocurrency lost a substantial portion of its market dominance. Both declines were associated with rapidly rising altcoin prices.
The largest decline in Bitcoin dominance occurred in 2017 during a broad altcoin season. BTC continued rising, but faster altcoin gains reduced BTC.D by almost a factor of 3. By early 2018, BTC dominance stood at just 35.5%.
During the subsequent bear market from 2018 to 2020, BTC.D rose steadily despite short-term corrections. By January 2021, the leading cryptocurrency’s dominance reached a cycle high of 72%.
The second major decline in BTC dominance occurred in the first half of 2021, falling from a local peak of 72% to 39.7%. During the second half of that year, dominance made only slightly lower lows and generally remained in the 39%-48% range until March 2023.
Since then, BTC.D has followed an upward trend, with no signs of reversal at the time of publication. Will there be an altcoin season in 2025 and a significant decline in BTC dominance? Time will tell…